Code Coverage for Functional Safety

Speed up Safety Certification & Improve Code Quality with TRACE32®-Based Code Coverage
Code coverage measurement is a requirement for certification to evaluate the completeness of test cases and to demonstrate that there is no unintended functionality. However, measurements are also made to increase code quality, e.g. to rule out the existence of dead code that is never executed.
When using traditional test tools, integration and system tests often generate considerable time and personnel expenditure due to the necessary code instrumentation, which can be reduced dramatically with trace-based code coverage measurements using our TRACE32® tools.
Code instrumentation is either not necessary at all, or only to a very limited extent. You need fewer build and test runs for a complete code coverage measurement, which leads to a saving of 50% of the total effort in real world examples. When you consider that these tests often take days or weeks to complete, you can estimate the time and cost benefits of utilizing TRACE32® for your code coverage measurements.
Benefit from Hundreds of Supported Architectures and Compilers
Get Test Results Faster during Integration & System Test
Measure all Metrics from Object Code Coverage to MC/DC
Measure Code Coverage in Real-Time
Use Qualifiable Simulators for Unit Testing
Easily Integrate with 3rd Party Tools
Select the Optimum Data Collection Mode According to Your Requirements
Depending on which architectures you use, which trace interfaces your chip implements - off-chip trace, on-chip trace or none at all - and which code coverage metrics you want to cover, you can select one of four different modes for data acquisition. These cover all conceivable use cases from maximum compatibility to maximum performance.
Use Real-Time Trace Capture to Minimize Your Time Expenditure
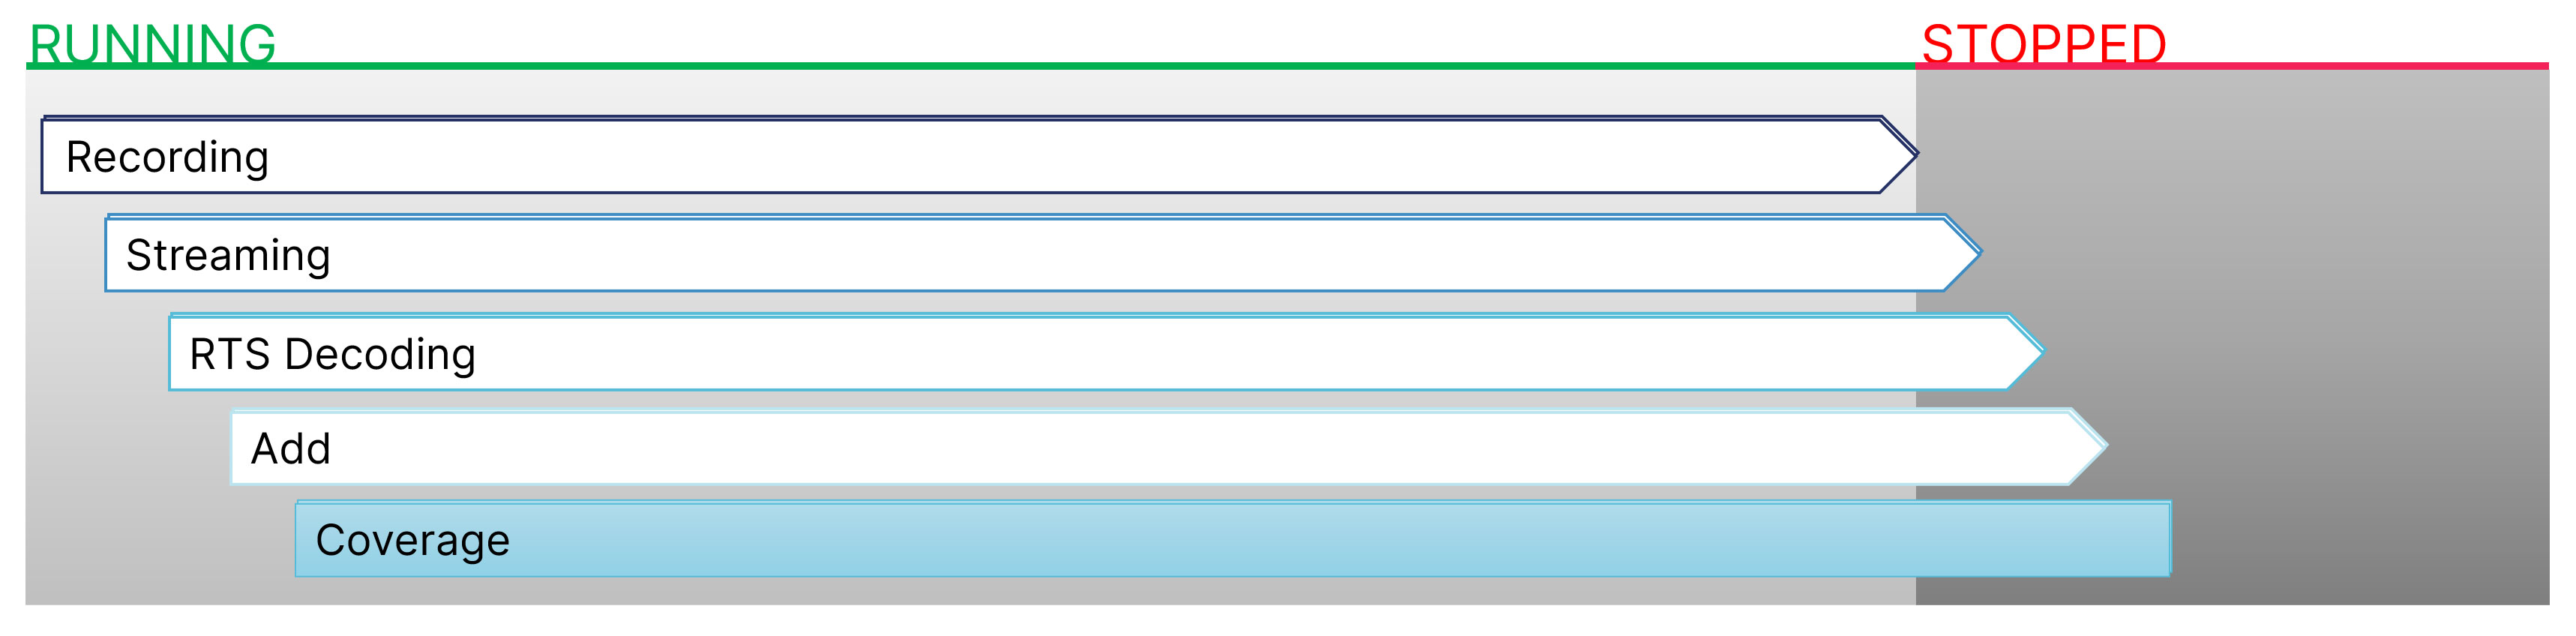
Our TRACE32® can process the trace data during recording in the operation mode RTS. The biggest advantage of RTS mode code coverage is that all necessary steps run in parallel and large amounts of trace data can be processed quickly, therefore your code coverage measurement results become available immediately. RTS is currently supported for Arm® ETMv3/v4 and PTM, Nexus for MPC5xxx/QorIQ, and AURIX MCDS trace prococols. RTS requires one of our TRACE32® trace extensions such as PowerTrace, CombiProbe or µTrace. The raw trace data are streamed to the host computer and decoded to reconstruct the program flow before the program flow is added to the code coverage system and the code coverage results are updated. All these steps are performed concurrently to minimize your time expenditure.
Stream Trace Data for All Instruction Set Architectures
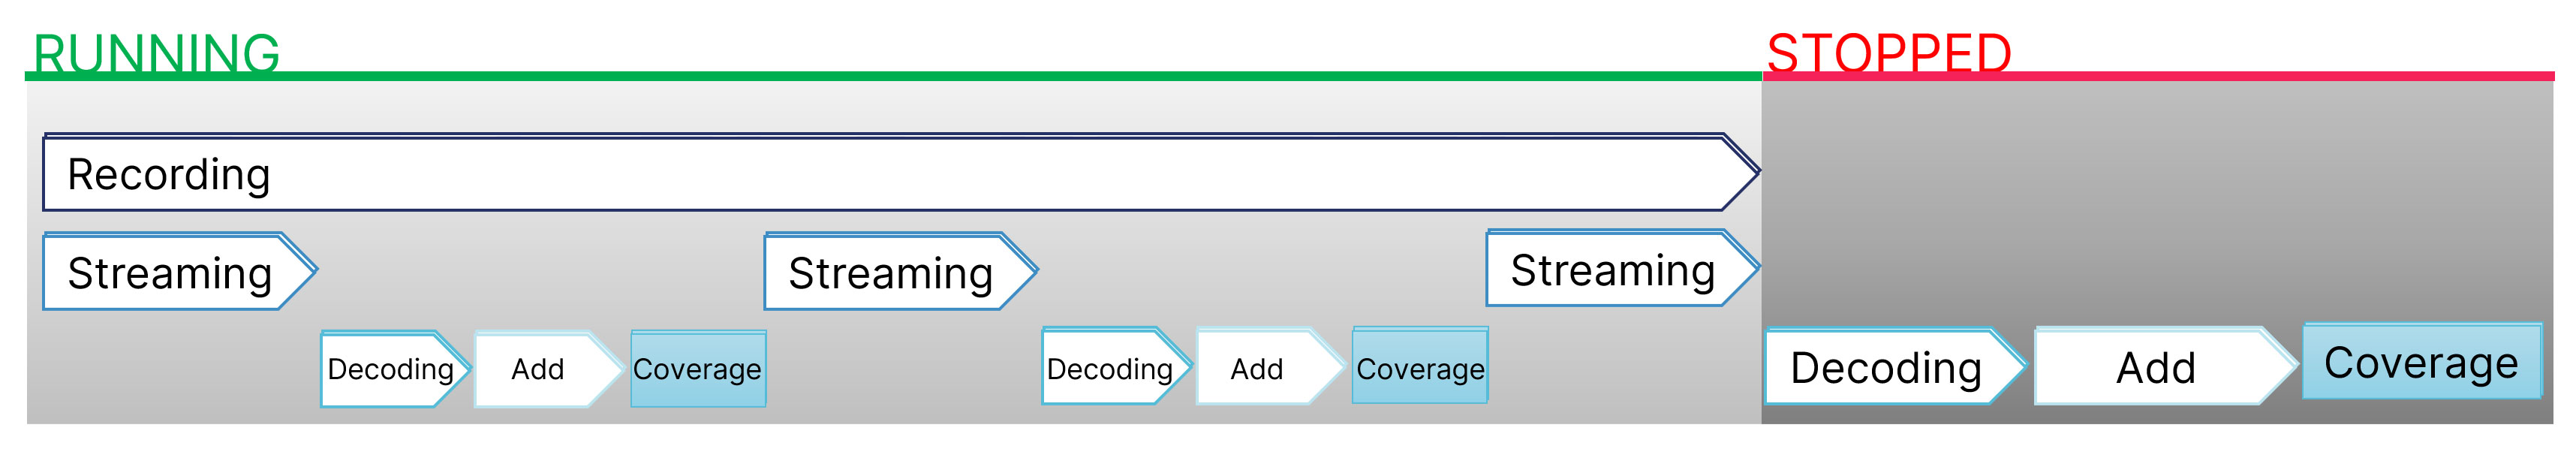
Our TRACE32® tools support processing of trace data while being recorded for all architectures in the operation mode SPY. SPY mode achieves slightly lower processing speeds than RTS mode, but supports all code coverage metrics and all chip architectures. For SPY mode code coverage, trace streaming is periodically suspended in order to decode the raw trace data and to process it for code coverage measurements. Your Code coverage measurement becomes available rapidly.
Benefit from Incremental Mode on Chips Providing On-Chip-Trace Only
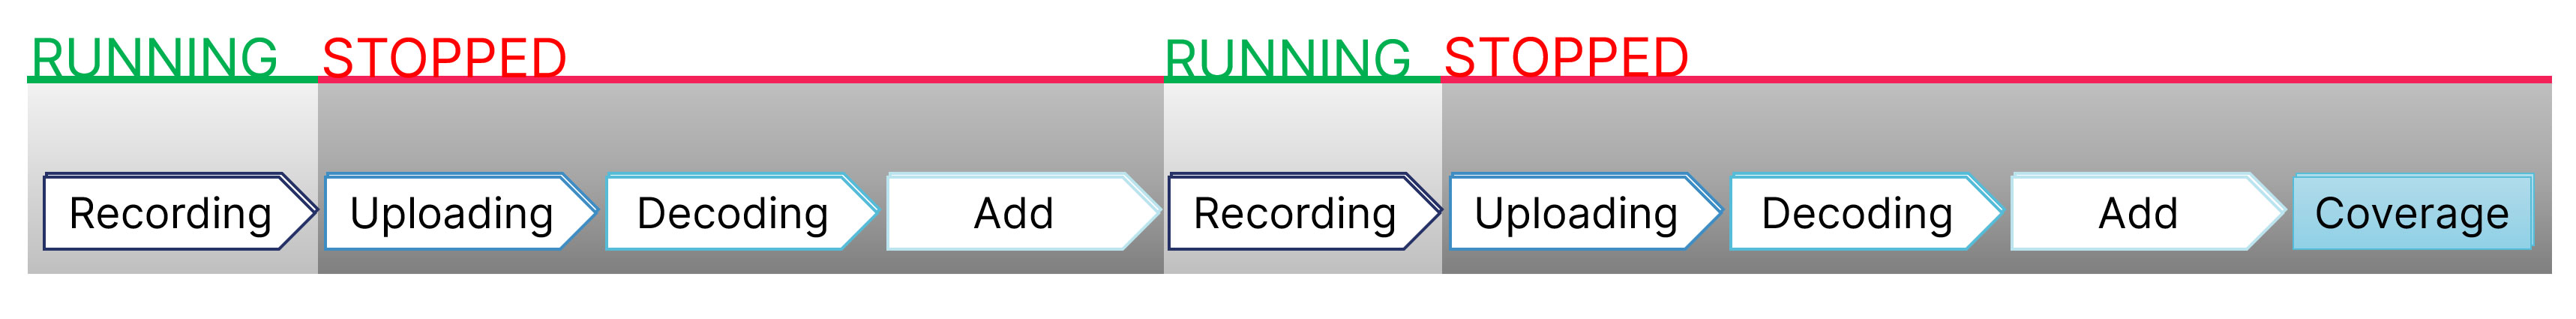
Incremental code coverage is supported by all processor architectures which provide information about program flow. It also supports all code coverage metrics. It is a reliable fallback method for chips implementing on-chip trace only and can be used in the vast majority of situations.
A characteristic feature of incremental code coverage is that the individual steps are executed one by one. Trace information is recorded while the program is running. After the program has been stopped, the raw trace data is uploaded to the host computer and decoded to reconstruct the complete program flow. After that, the program flow is finally added to the code coverage system and the code coverage results are updated.
Collect Trace Data Even on Chips without A Trace Interface
Our special data collection mode ART(Advanced Register Trace) operates by single stepping on assembler level. After each step, the contents of the CPU registers are uploaded to our TRACE32® PowerView software and stored in a similar fashion to a program flow trace. This pseudo-trace data can be used for code coverage. You can use trace data recorded with ART for all code coverage metrics.
ART allows the collection of data even on chips without any trace interface, however, it has a significant impact on the real-time performance of the target. To improve the performance, we recommend to use our TRACE32® Instruction Set Simulator (ISS), which supports all code coverage metrics as well. The ISS simulates the instruction set and provides a bus trace so that code coverage is easy to perform.
Covering All Coverage Metrics
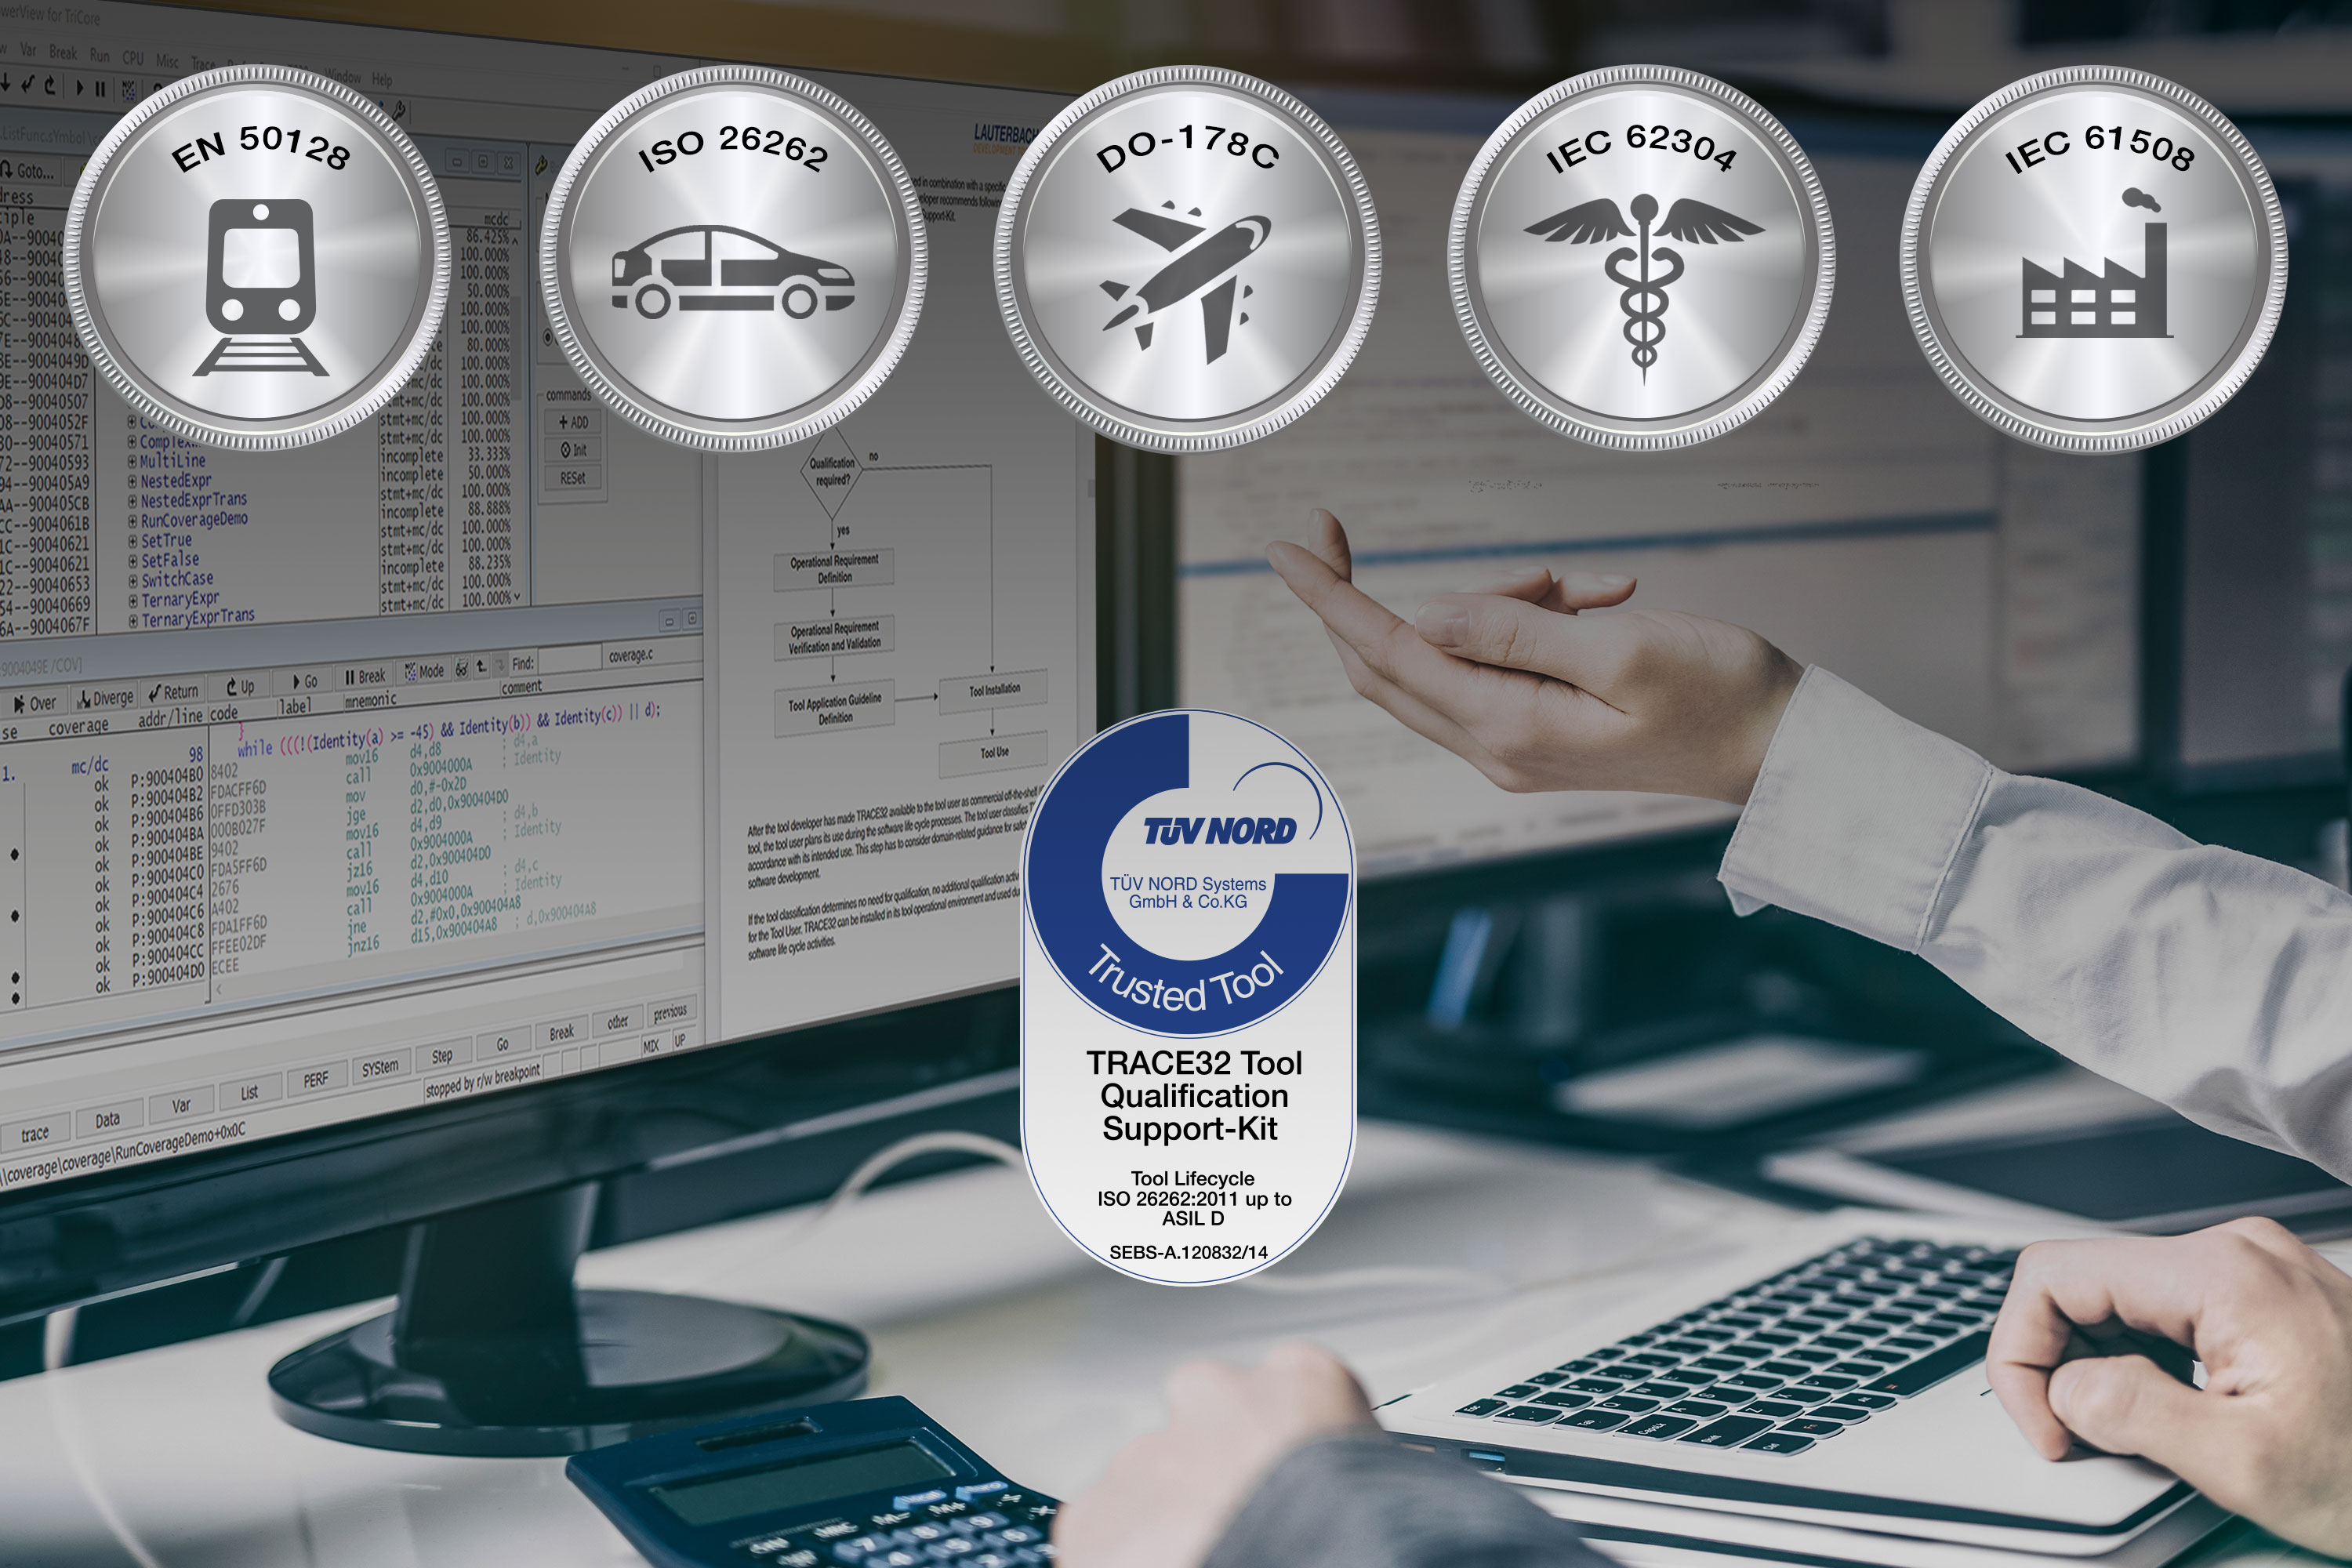
Test coverage and test progress can be quantitatively determined using code coverage measurements. Depending on the criticality of your embedded system and the individual application-specific standards for functional safety, you have to apply different levels of coverage, usually called code coverage metrics. Essentially, the individual levels of code coverage are assigned as follows: function level, instruction level, branch level, path level and condition level. The different levels of coverage supported by our TRACE32® trace tools fulfill all requirements as defined in the standards ISO 26262 (Automotive), IEC 62304 (Medical Devices), DO 178C (Avionics), EN 50128 (Railway) and IEC 61508 (the Umbrella Standard for Industrial Projects).
Object Code Coverage
Object code coverage measures whether each object code instruction was executed at least once and all conditional instructions (e.g. conditional branches) have evaluated to both true and false.
Function Coverage
Function coverage measures whether all functions of the program have been reached at least once. Complete function coverage is achieved when every function of the program has been called during the test. 100% call coverage doesn’t imply 100% function coverage.
Call Coverage
Call coverage is a measure of the number of calls to functions that have been exercised during the execution of a program, as a percentage of the number of calls that exist in that program. 100% function coverage doesn’t imply 100% call coverage.
Statement Coverage
Statement coverage measures how high the proportion of tested statements is compared to all statements. At this level, it is therefore possible to find dead code or statements for which there are no tests yet.
Decision Coverage / Branch Coverage
At this coverage level, each decision must be tested at least once as “true” and “false”. For normal “if statements”, this corresponds to branch coverage, where every branch must have been executed (branch coverage). To achieve decision or branch coverage, branches without statements must also be run through. For an “if statement” without an else block, the case that the associated decision is incorrect must still be tested. Full statement coverage follows from (full) decision coverage, in this sense it is the stronger measure.
Condition Coverage
In addition to the requirements of decision coverage, condition coverage considers composite decisions in detail. In the case of decisions that consist of several atomic conditions composed via Boolean operators, each of these conditions must be tested individually as “true” and “false”. Condition coverage is essentially only relevant for understanding multicondition coverage and, in particular, modified condition/decision coverage (MC/DC).
Modified Condition/Decision Coverage (MC/DC)
With multicondition coverage, all possible true/false combinations must be checked for composite decisions. If there are several conditions within a decision, this usually requires an impractically high number of test cases, as this number grows exponentially with the number of conditions in the decision. For this reason, multicondition coverage is not required in any safety standard, but rather modified condition/decision coverage (MC/DC). With it, the number of test cases only increases linearly with the number of conditions, but at the same time it is more difficult to understand and also more difficult to determine.
Meet Automotive Safety Integrity Level (ASIL) Requirements According to ISO 26262
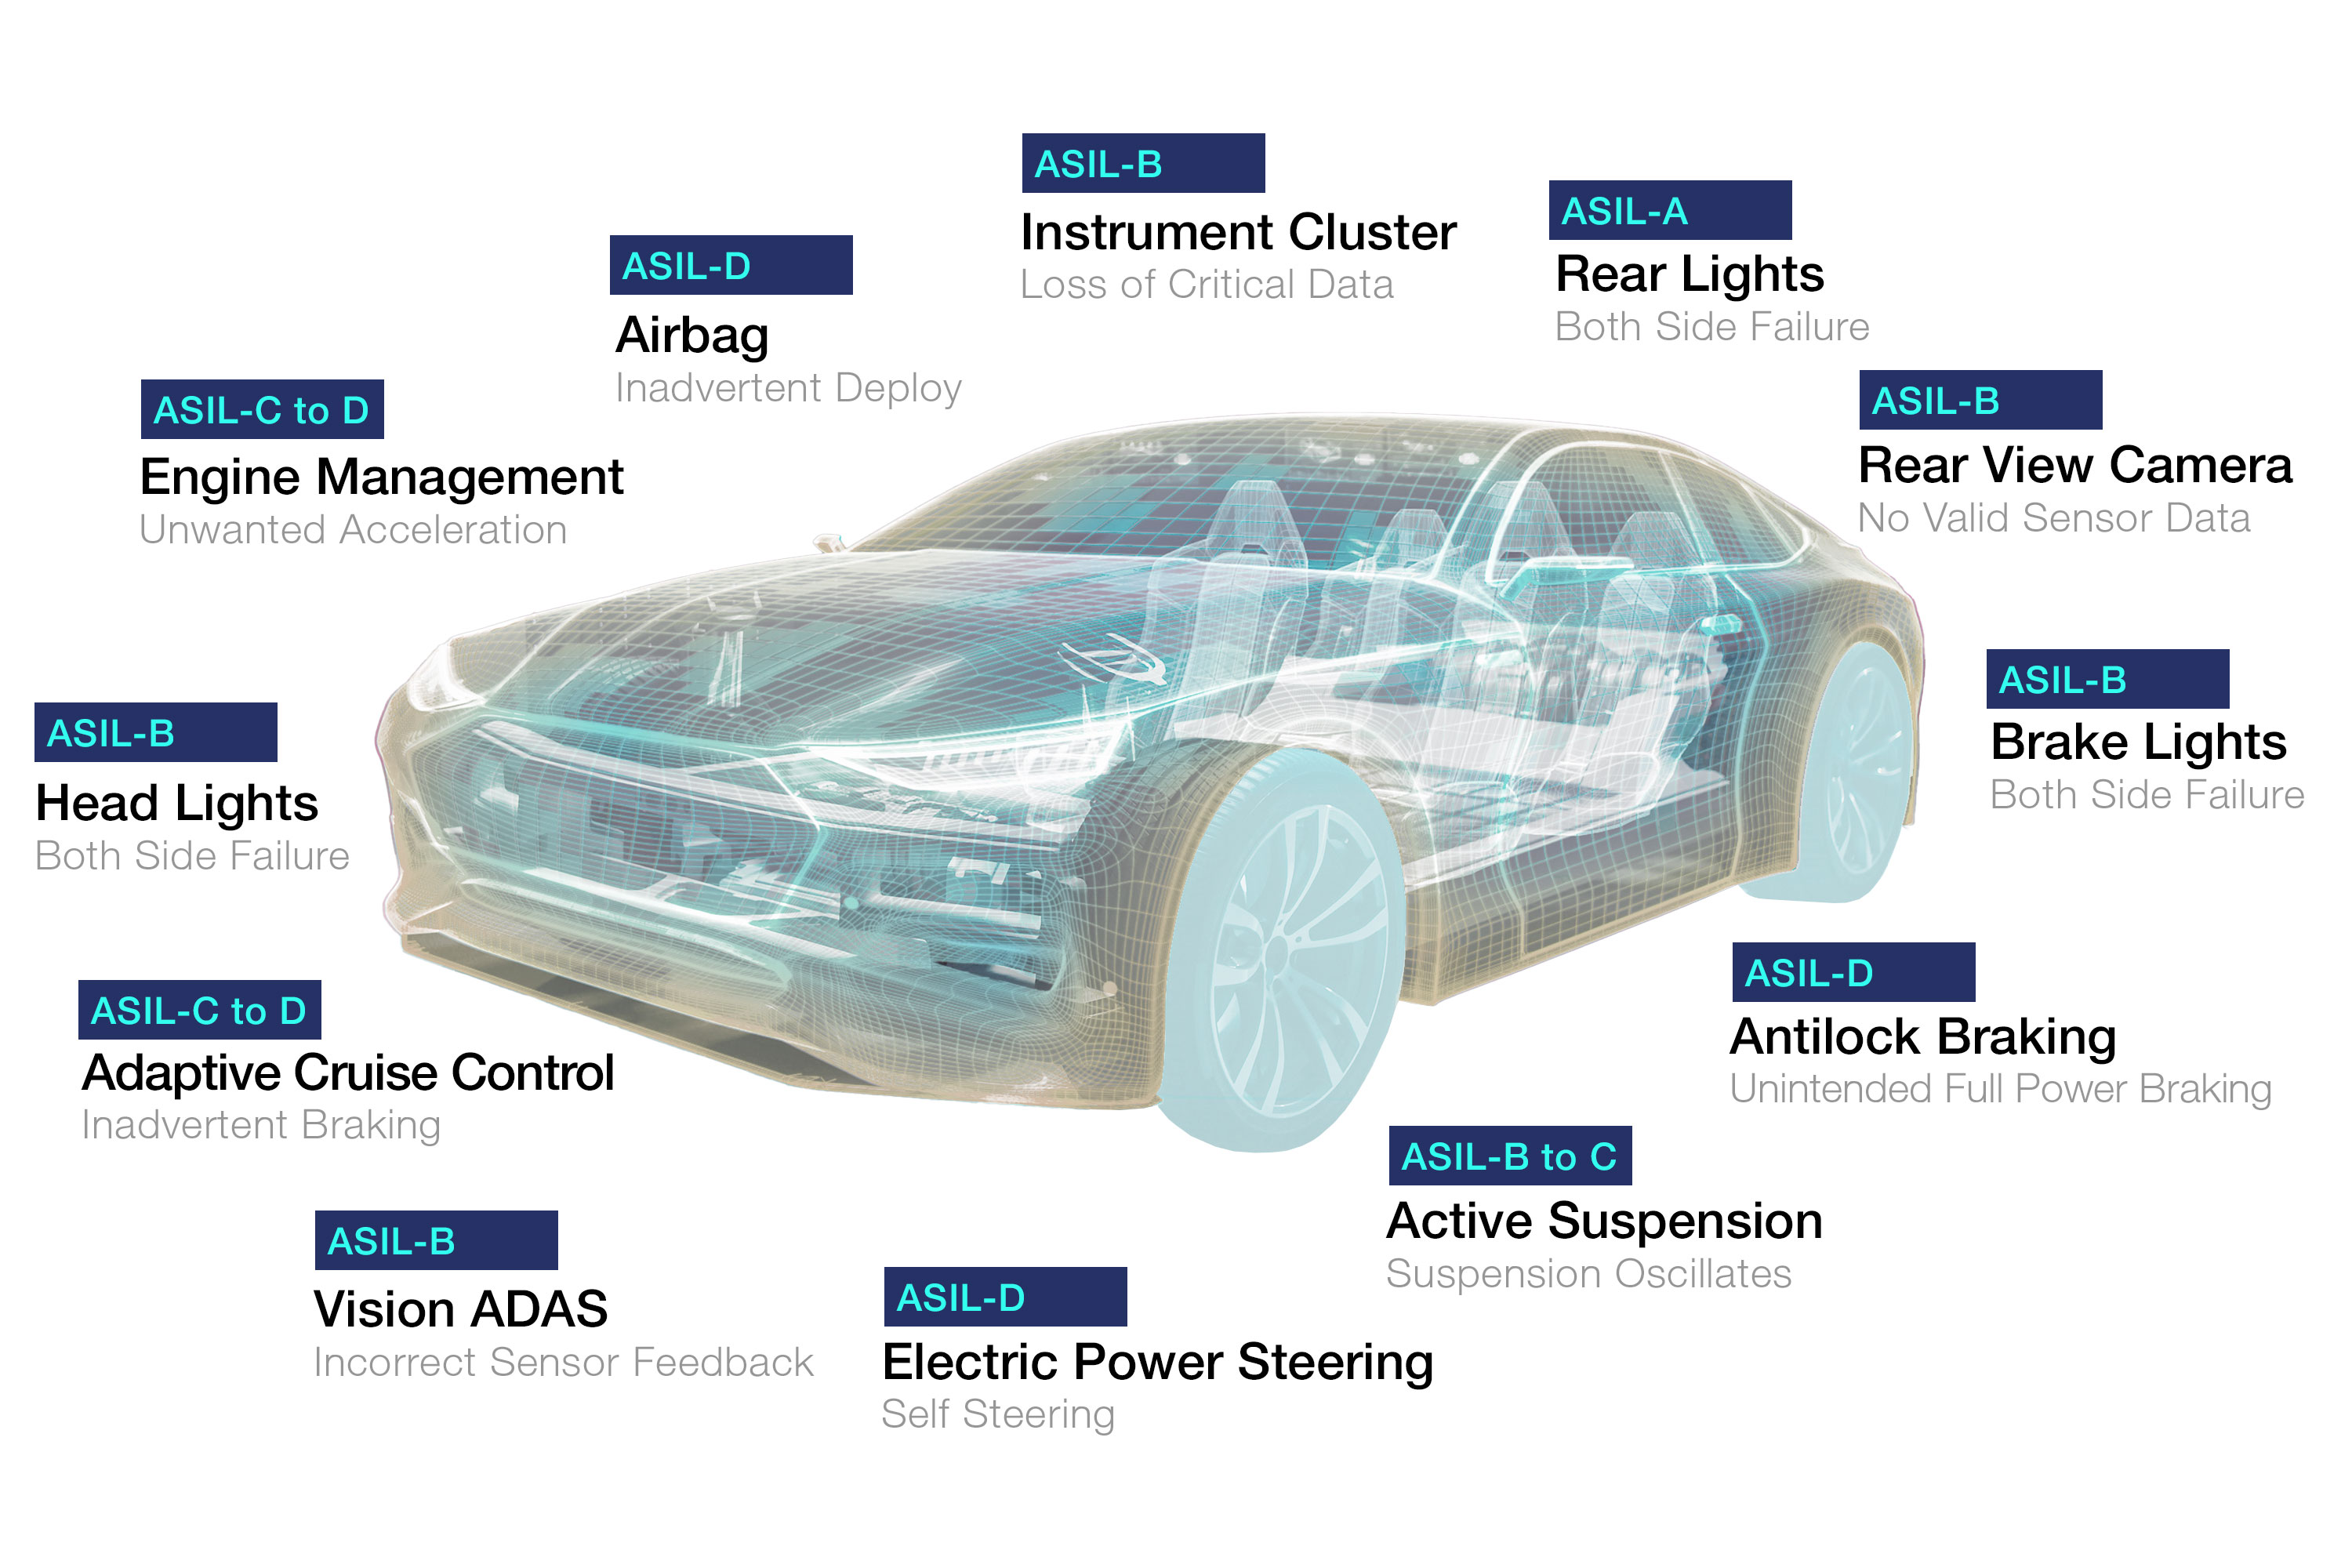
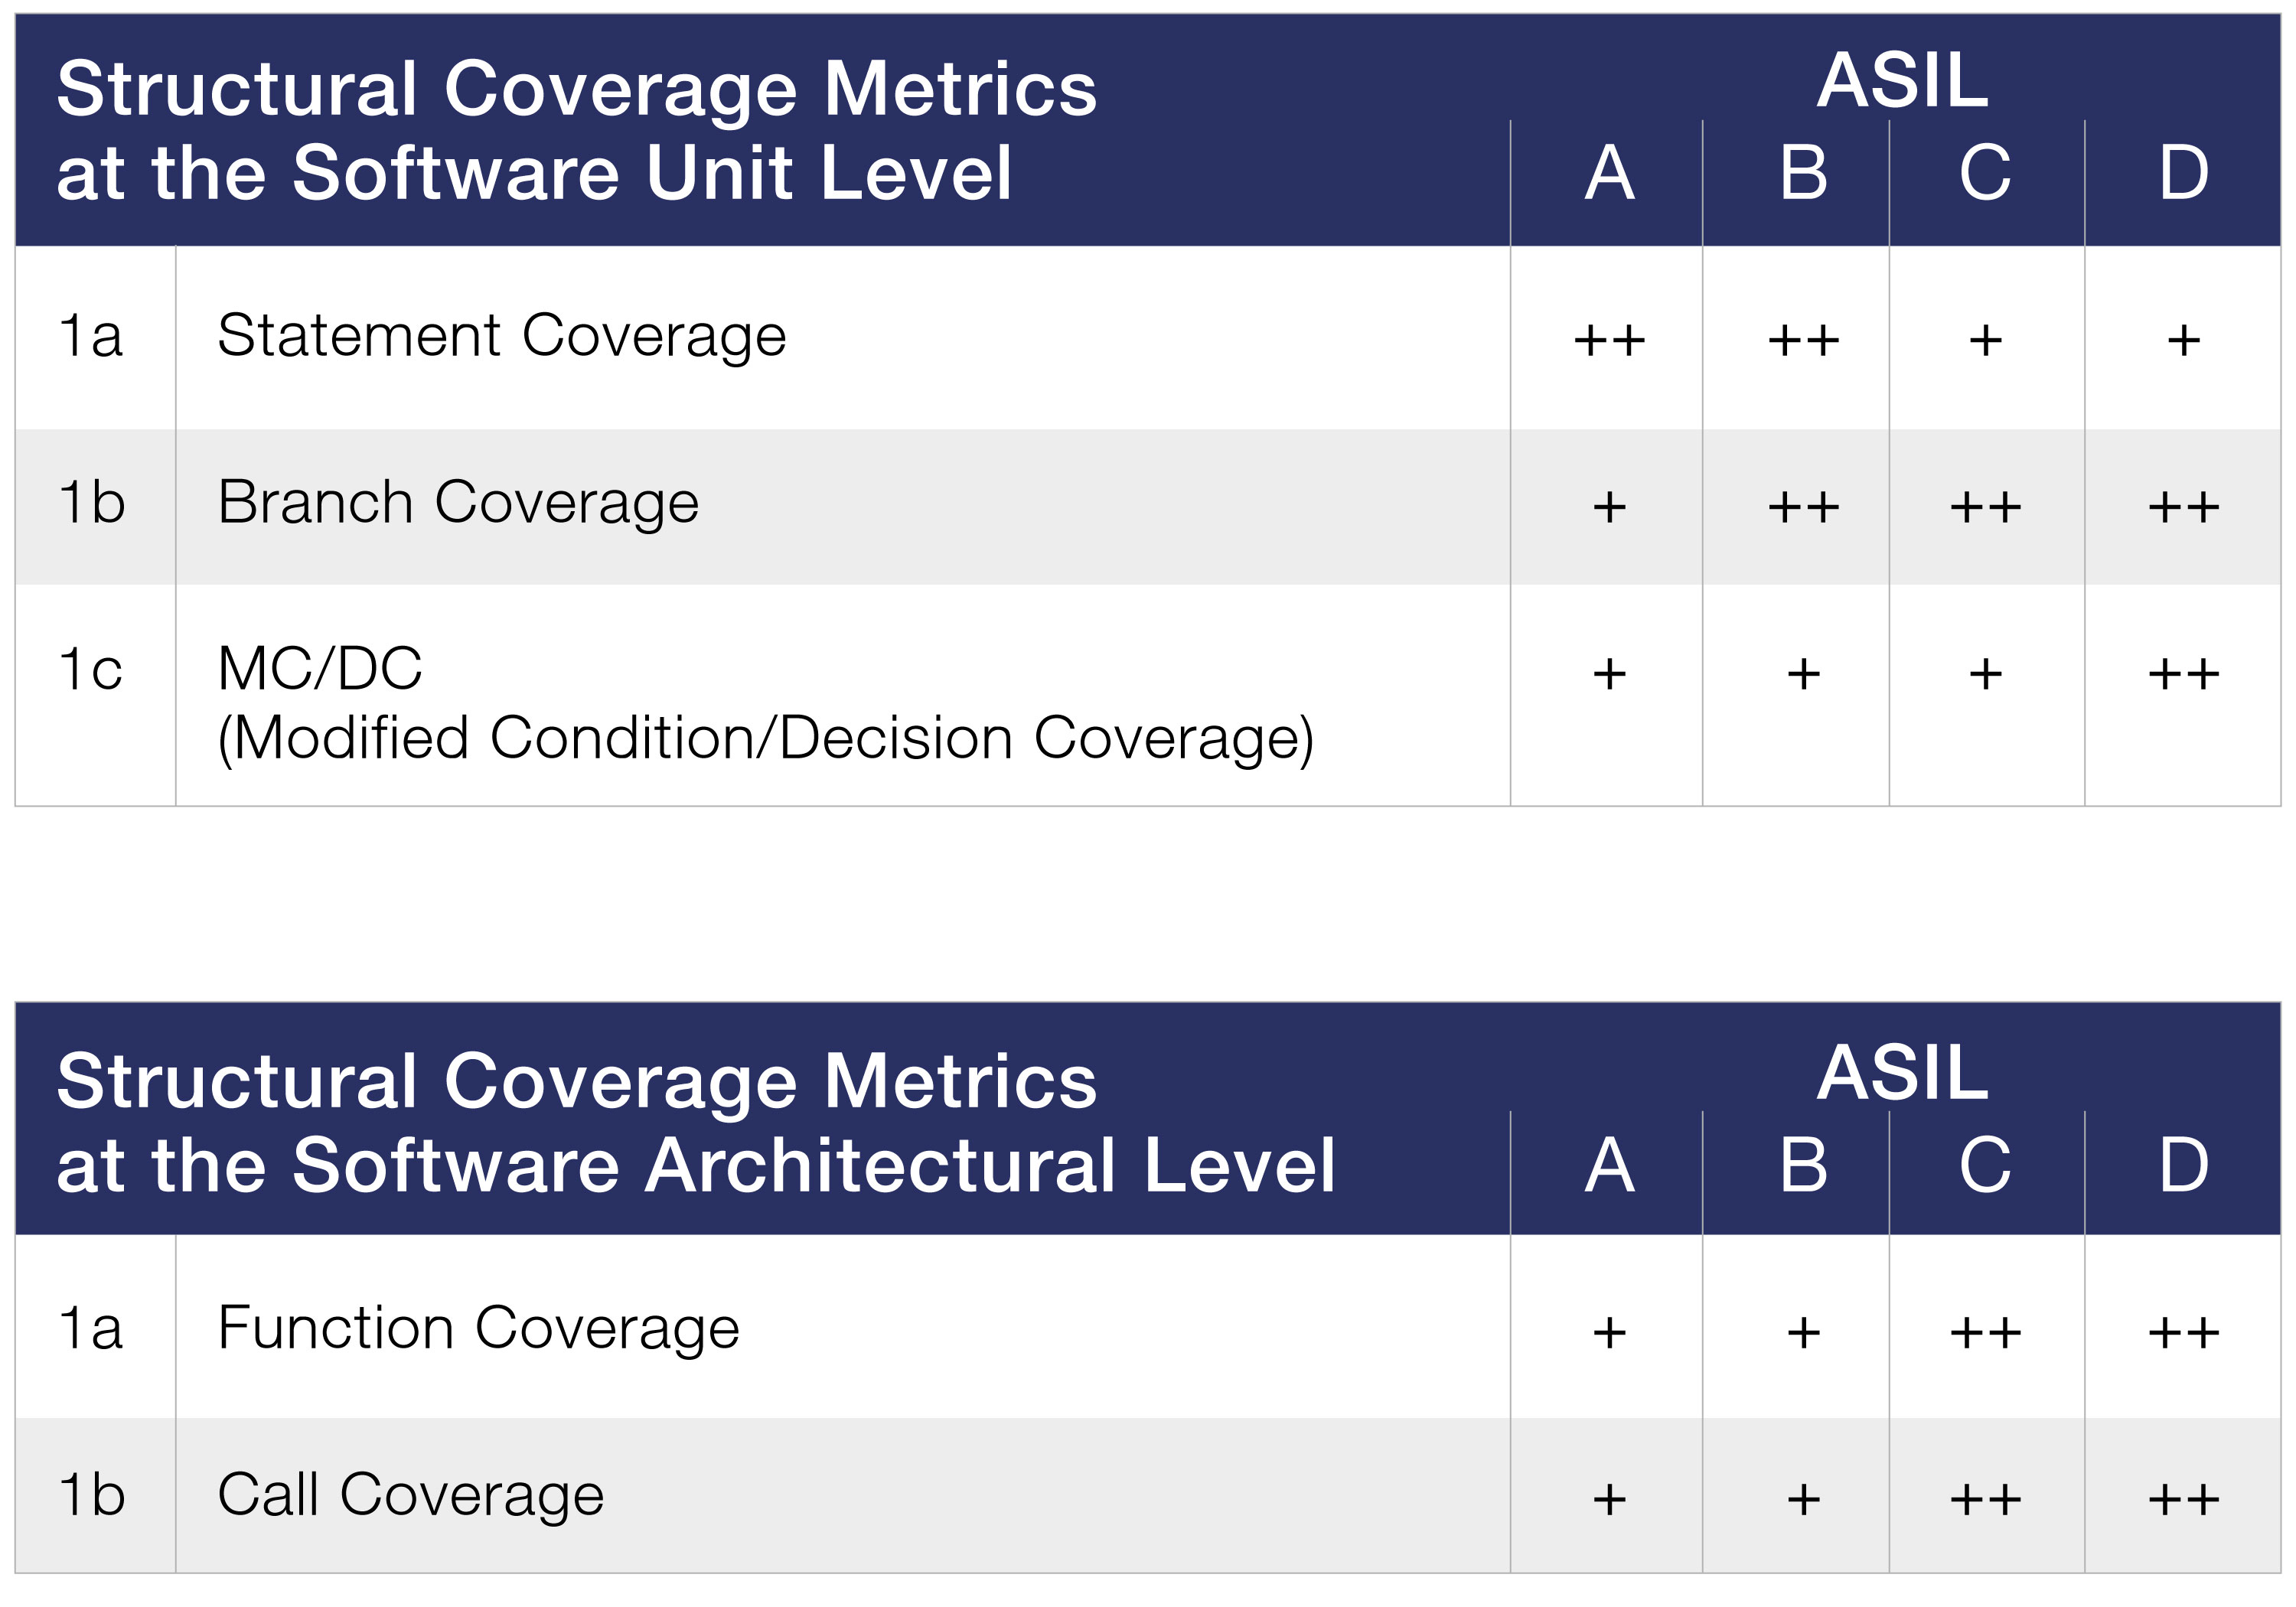
ISO 26262, where the Automotive Safety Integrity Level (ASIL) is introduced, is to be used for safety-relevant electrical/electronic systems in motor vehicles. The standard also recommends code coverage measurements being used at function and architecture level. In the tables on the right you can find the structural coverage metrics at the software unit level (ISO 26262-6:2018, Table 9) as well as structural coverage metrics at the software architectural level (ISO 26262-6:2018, Table 12).
The fields marked with “++” indicate that the specified measure is particularly recommended. If, for a specific reason, a decision is made not to comply with this requirement and to dispense with the measure described, a detailed explanation must be provided as to why this decision was made and what effects it has. Recommended measures are marked with a simple “+” and indicate that the corresponding measure results in an improvement in quality or safety.
Since you can measure all the metrics listed in the tables on the right with our TRACE32® trace tools, you can fully meet the code coverage related requirements up to the highest level ASIL-D.
Analyze Your Results in PowerView and Beyond
We provide you with several reporting options for the evaluated code coverage measurements. This includes the display within our PowerView software, the export into several human-readable and machine-readable formats as well as our TRACE32® Code Coverage Merging and Reporting Tool which you can use to merge results from different test runs and different target platforms.
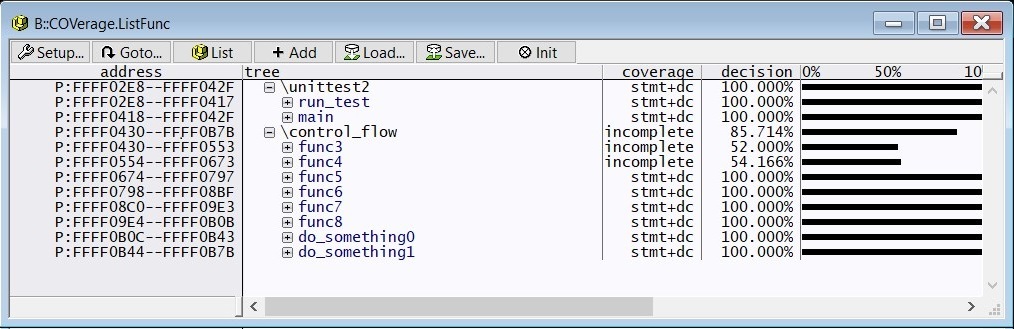
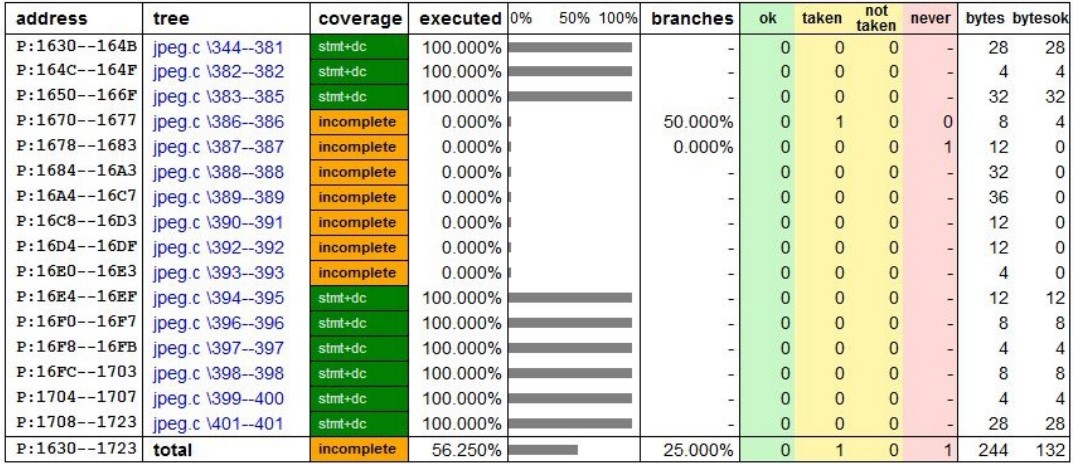
Display Code Coverage Measurements in PowerView
In a PowerView window, you can immediately display the coverage results of all functions or modules under consideration for the measured metrics.
Generate Human-Readable Reports in XML
With the help of our TRACE32® Report Utility you can display the results of your code coverage measurements in the internet browser of your choice.
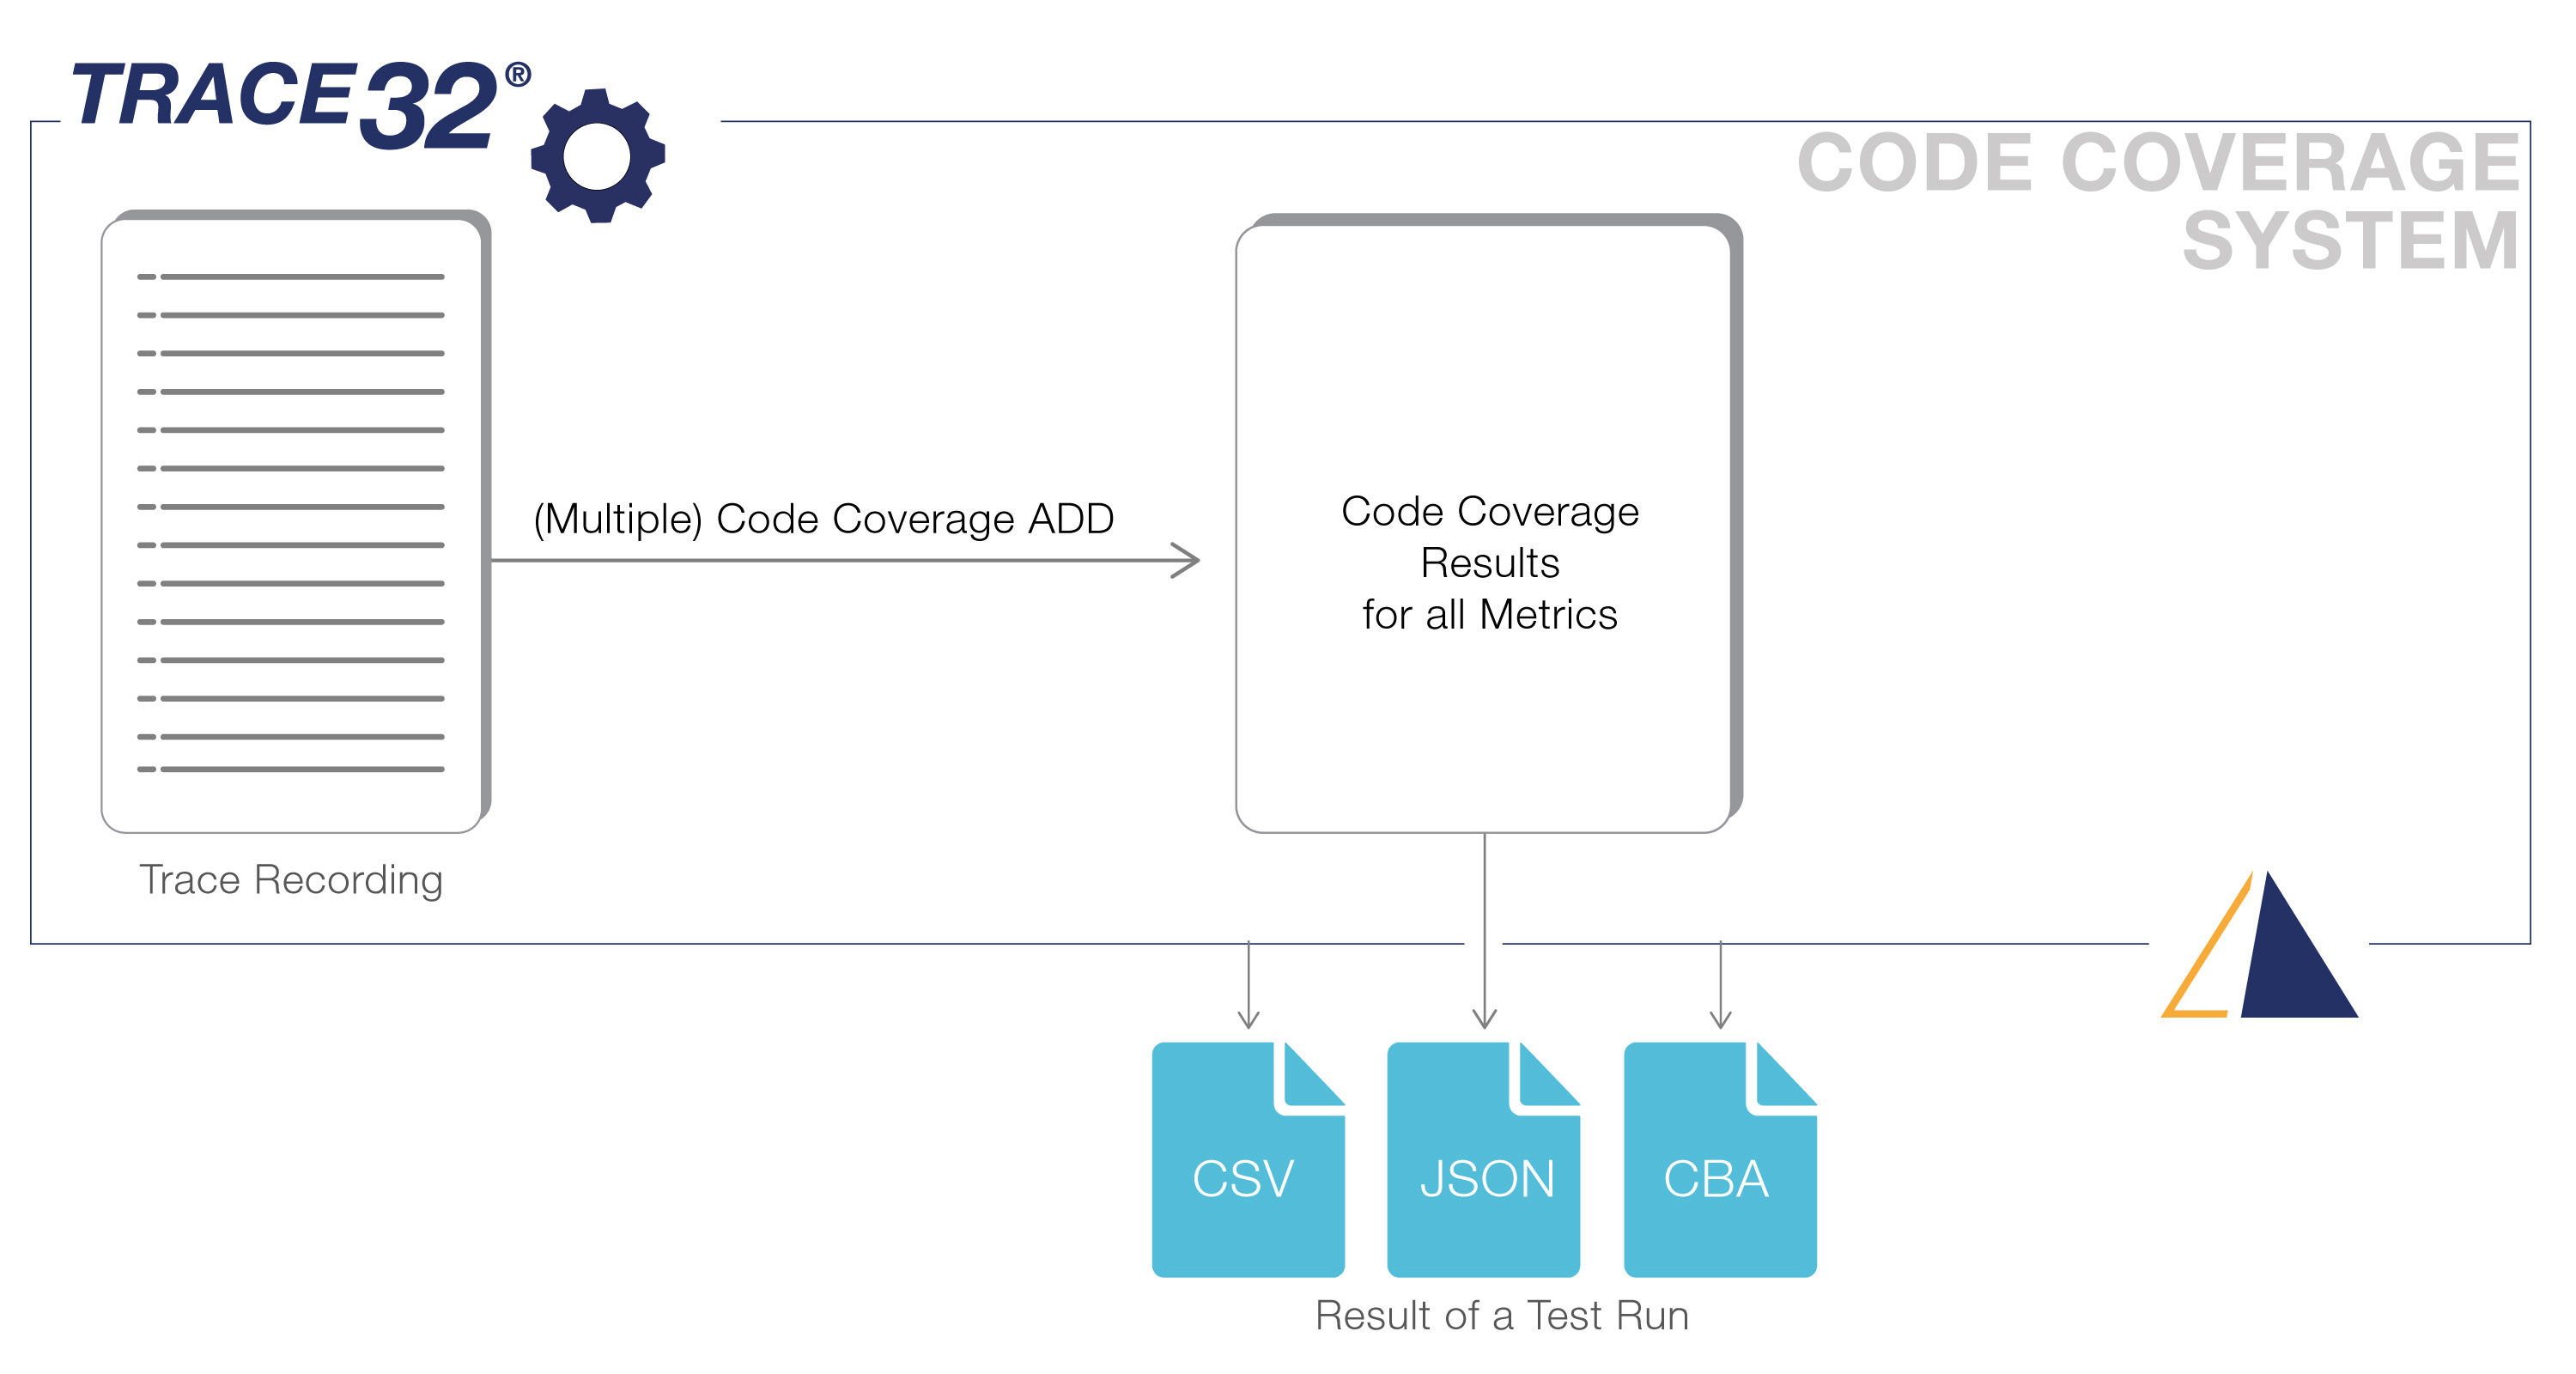
Generate Machine-Readable Reports in CSV, JSON or VectorCAST CBA
After concluding the test run, you can export the outcomes for all source code metrics, stored within our TRACE32's internal code coverage system, to a file. Supported source code metrics include statement, decision and condition coverage, MC/DC, as well as call and function coverage. You can choose between the open file formats CSV or JSON (JavaScript Object Notation) and the proprietary CBA format for further processing of the data in VectorCAST.
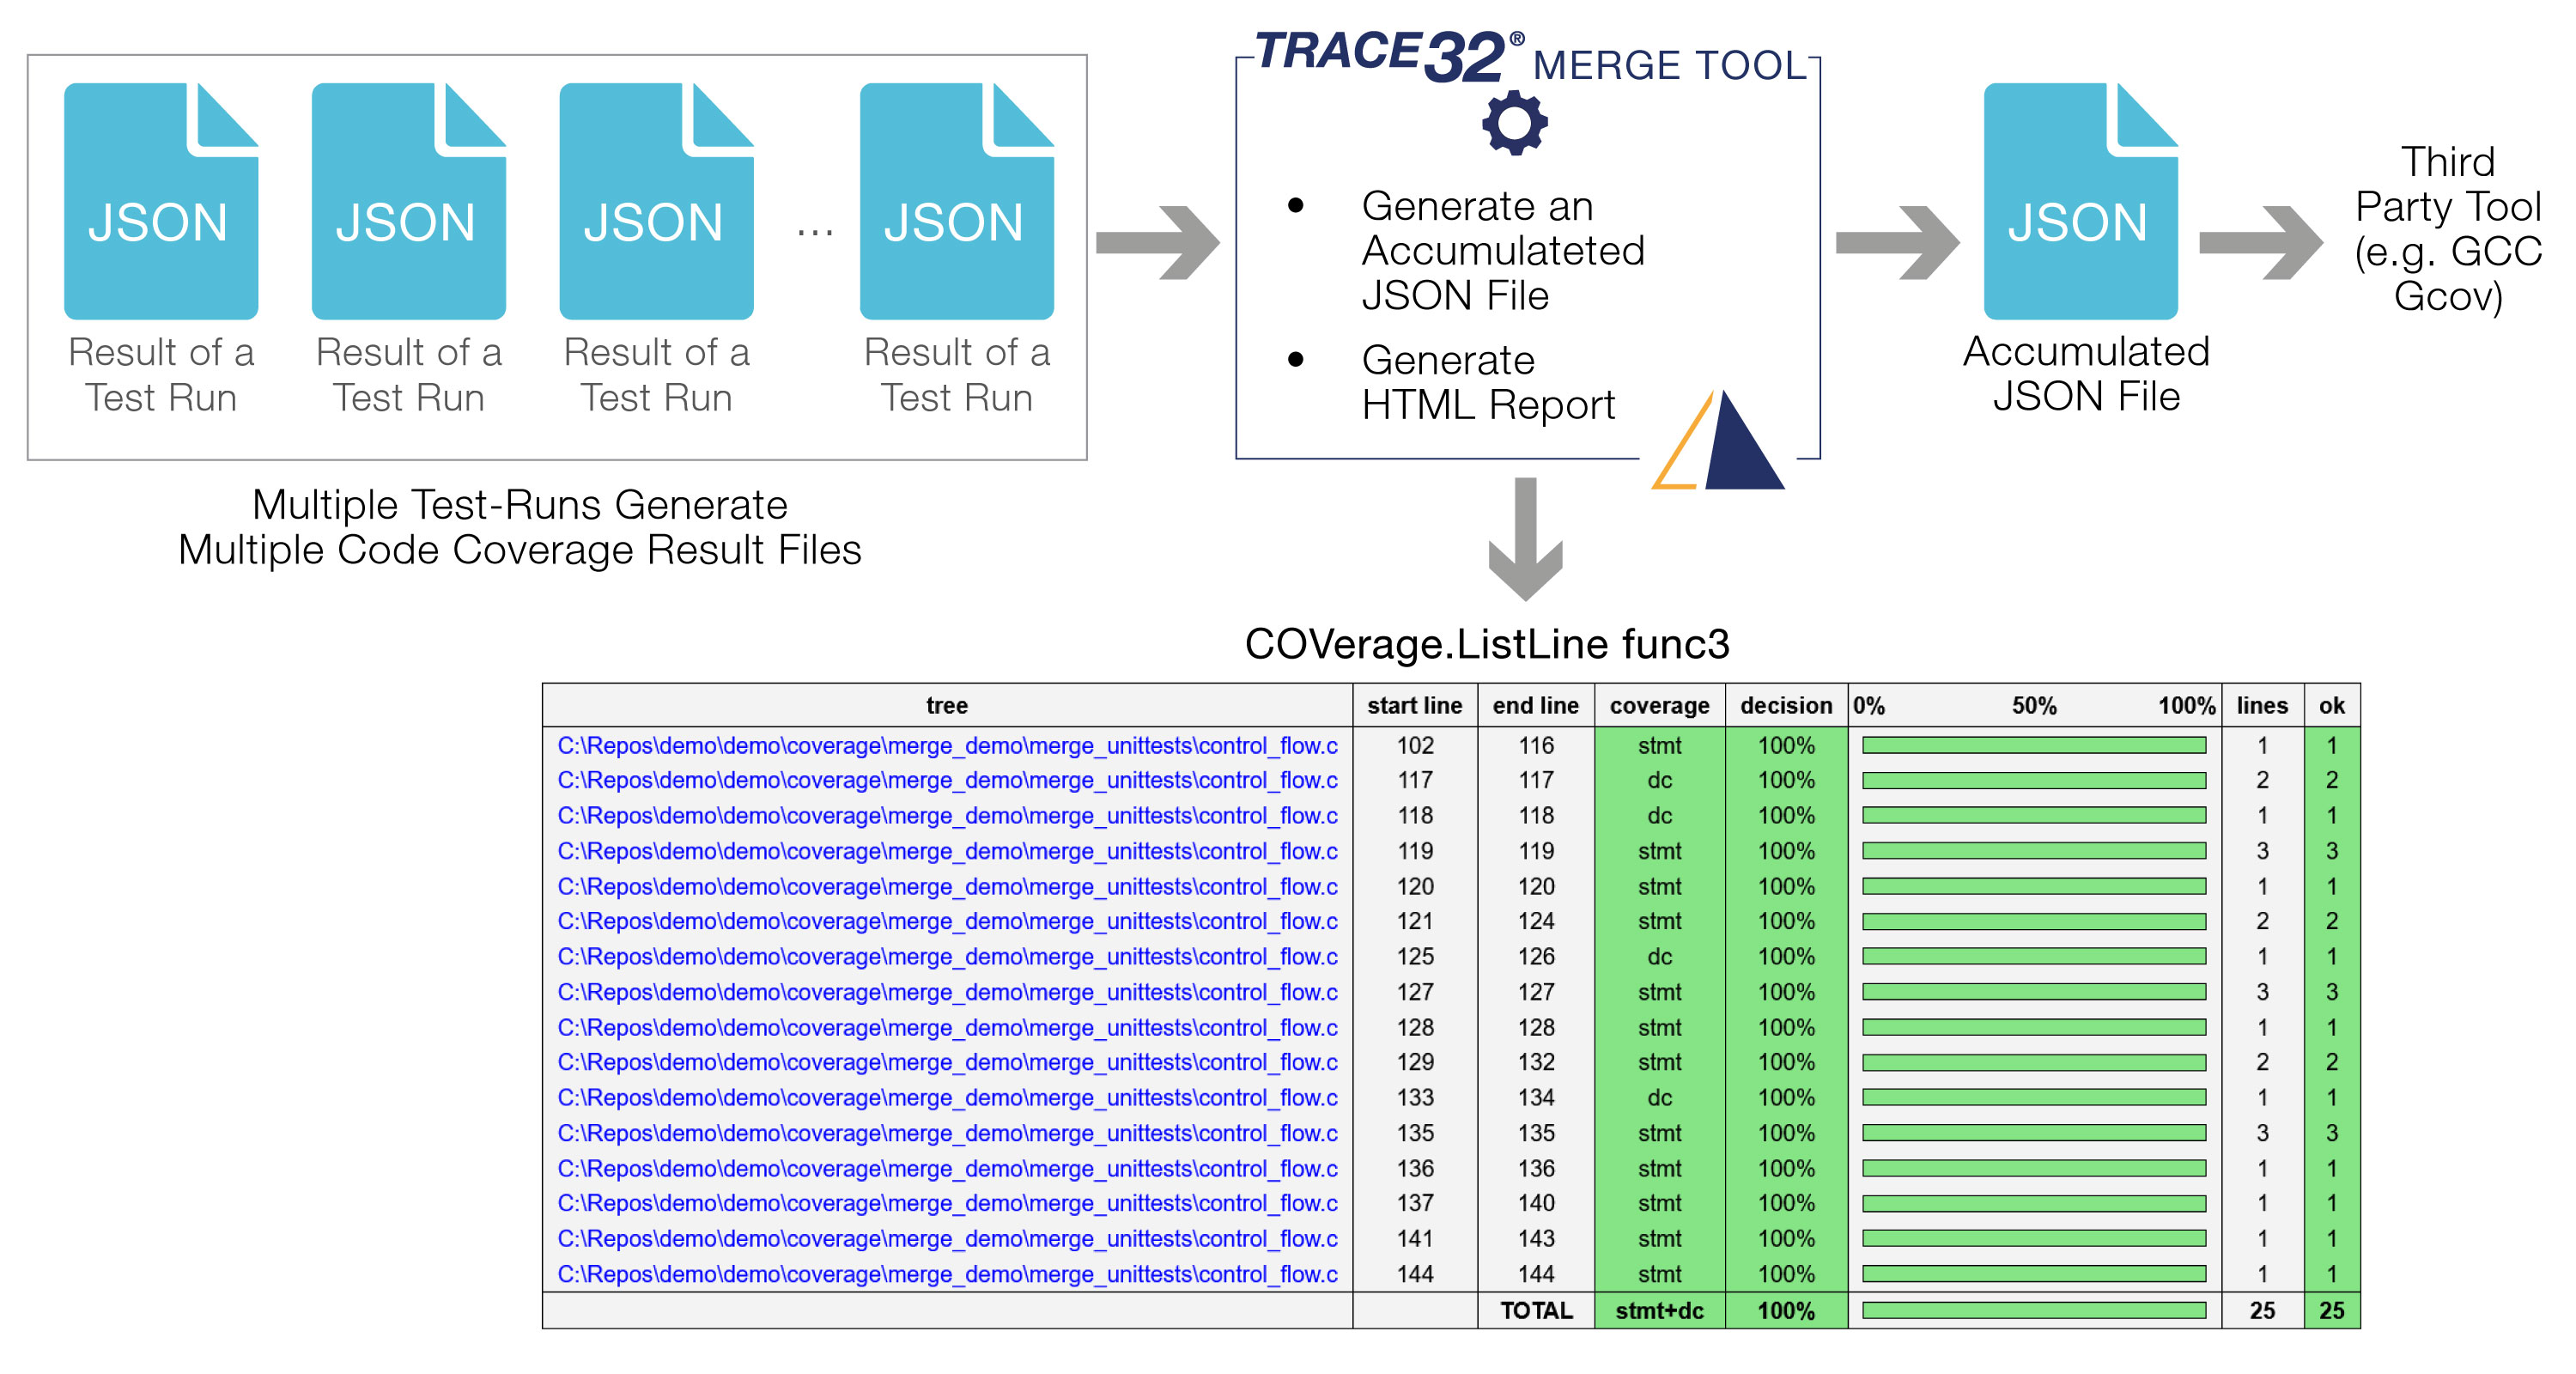
Generate Machine-Readable Reports with the TRACE32® Code Coverage Merging and Reporting Tool
Our TRACE32® Code Coverage Merging and Reporting Tool allows you to consolidate the results of multiple code coverage test runs performed with different ELFs based on different suites of test cases, or using different target configurations. The tool is compatible with Windows and Linux operating systems and uses exported JSON files to merge the TRACE32® code coverage results from various test runs. At the same time, these results are translated into a visually appealing HTML report for analysis and documentation purposes. The open and extendable JSON format permits processing of the merged code coverage measurements by many third-party tools.
Save Time and Effort with Our Tool Qualification Support Kit
The qualification of safety-critical embedded systems also includes the development tools used and their integration into the project environment. Our certified Tool Qualification Support Kits (TQSK) provide everything you need to qualify our TRACE32® solutions for use in avionics, medical, automotive, railroad, or general industrial projects and reduce your time-to-market, effort, and costs.
Besides many other artifacts our TQSK includes the Test Suite – Coverage which provides test cases for statement and branch coverage, MC/DC, condition, function and call coverage. It supports source code coverage for C, assembly level coverage for executable object code, and Incremental as well as RTS and SPY code coverage modes.
Easily Integrate with Third Party Tools
When using traditional test tools, integration and system tests often generate considerable time and personnel expenditure due to the necessary code instrumentation, which can be reduced dramatically with trace-based code coverage measurements using our TRACE32® tools. Nevertheless traditional test tools and their code coverage measurement capabilities including their sophisticated test case and requirement management, can play to their strengths particularly in unit testing.
The combination of traditional test tools and TRACE32® provides you the best possible customer experience for efficient and time saving code coverage measurements. Currently you can import TRACE32® code coverage measurements into three widely distributed and well-known third party tools.
-
The LDRA tool suite®
The LDRA tool suite provides requirements traceability, test management, coding standards compliance, code quality reviews, code coverage analysis, data-flow and control-flow analysis, unit/integration/target testing to achieve certification in accordance with rigorous industry standards.
Learn more -

RapiCover/RapiCoverZero
Both RapiCover and RapiCoverZero support on-target structural coverage analysis for critical software. With automated coverage reporting up to MC/DC, support for testing decisions with up to 1000 conditions, and qualification support, RVS solutions ensure that you get the most from your testing.
Learn more
VectorCAST
The VectorCAST embedded software testing platform is a family of products that automates testing activities across the software development lifecycle. The VectorCAST product family is used in the fields of avionics, medical device, automotive, industrial controls, railway and financial industries.
Learn more