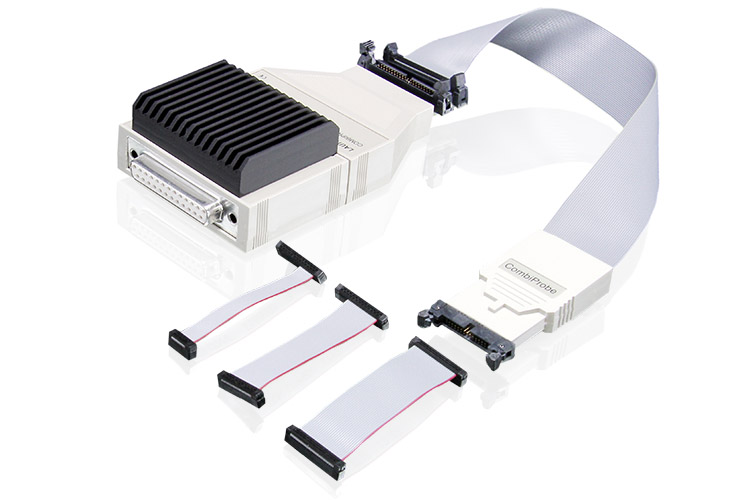
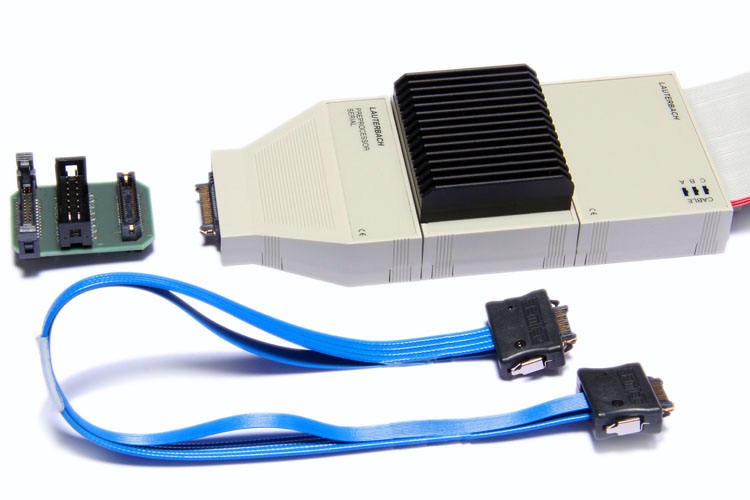
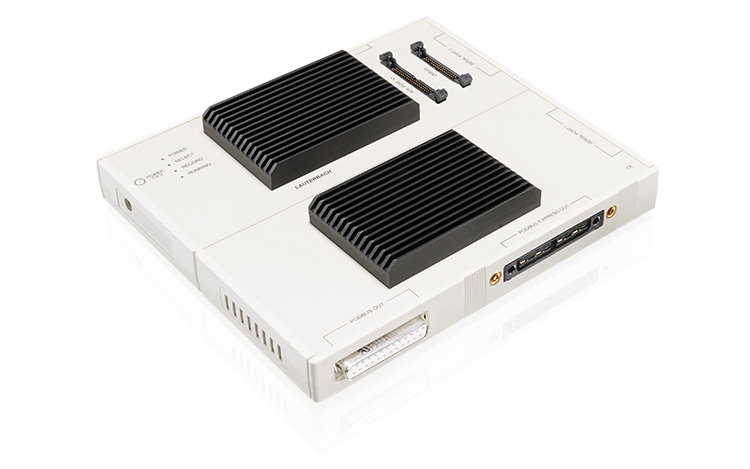
TriCore™ Debugger & Trace

OVERVIEW

Total TriCore Debug and Trace

By combining elements of a RISC processor core, a microcontroller, and a DSP into a single MCU, TriCore has become the de-facto processor for modern automotive systems. A powerful architecture with multiple cores and a well-defined debug interface is allowing TriCore expand its reach to include Secure Systems, Industrial Control, Artificial Intelligence, and Machine Learning. TRACE32 offers a number of debug and trace solutions for all TriCore devices.

Supported Families

AURIX: TC4x / TC3xx / TC2xx, TC1xxx: AUDO / industrial / ...

ADVANCED DEBUGGING

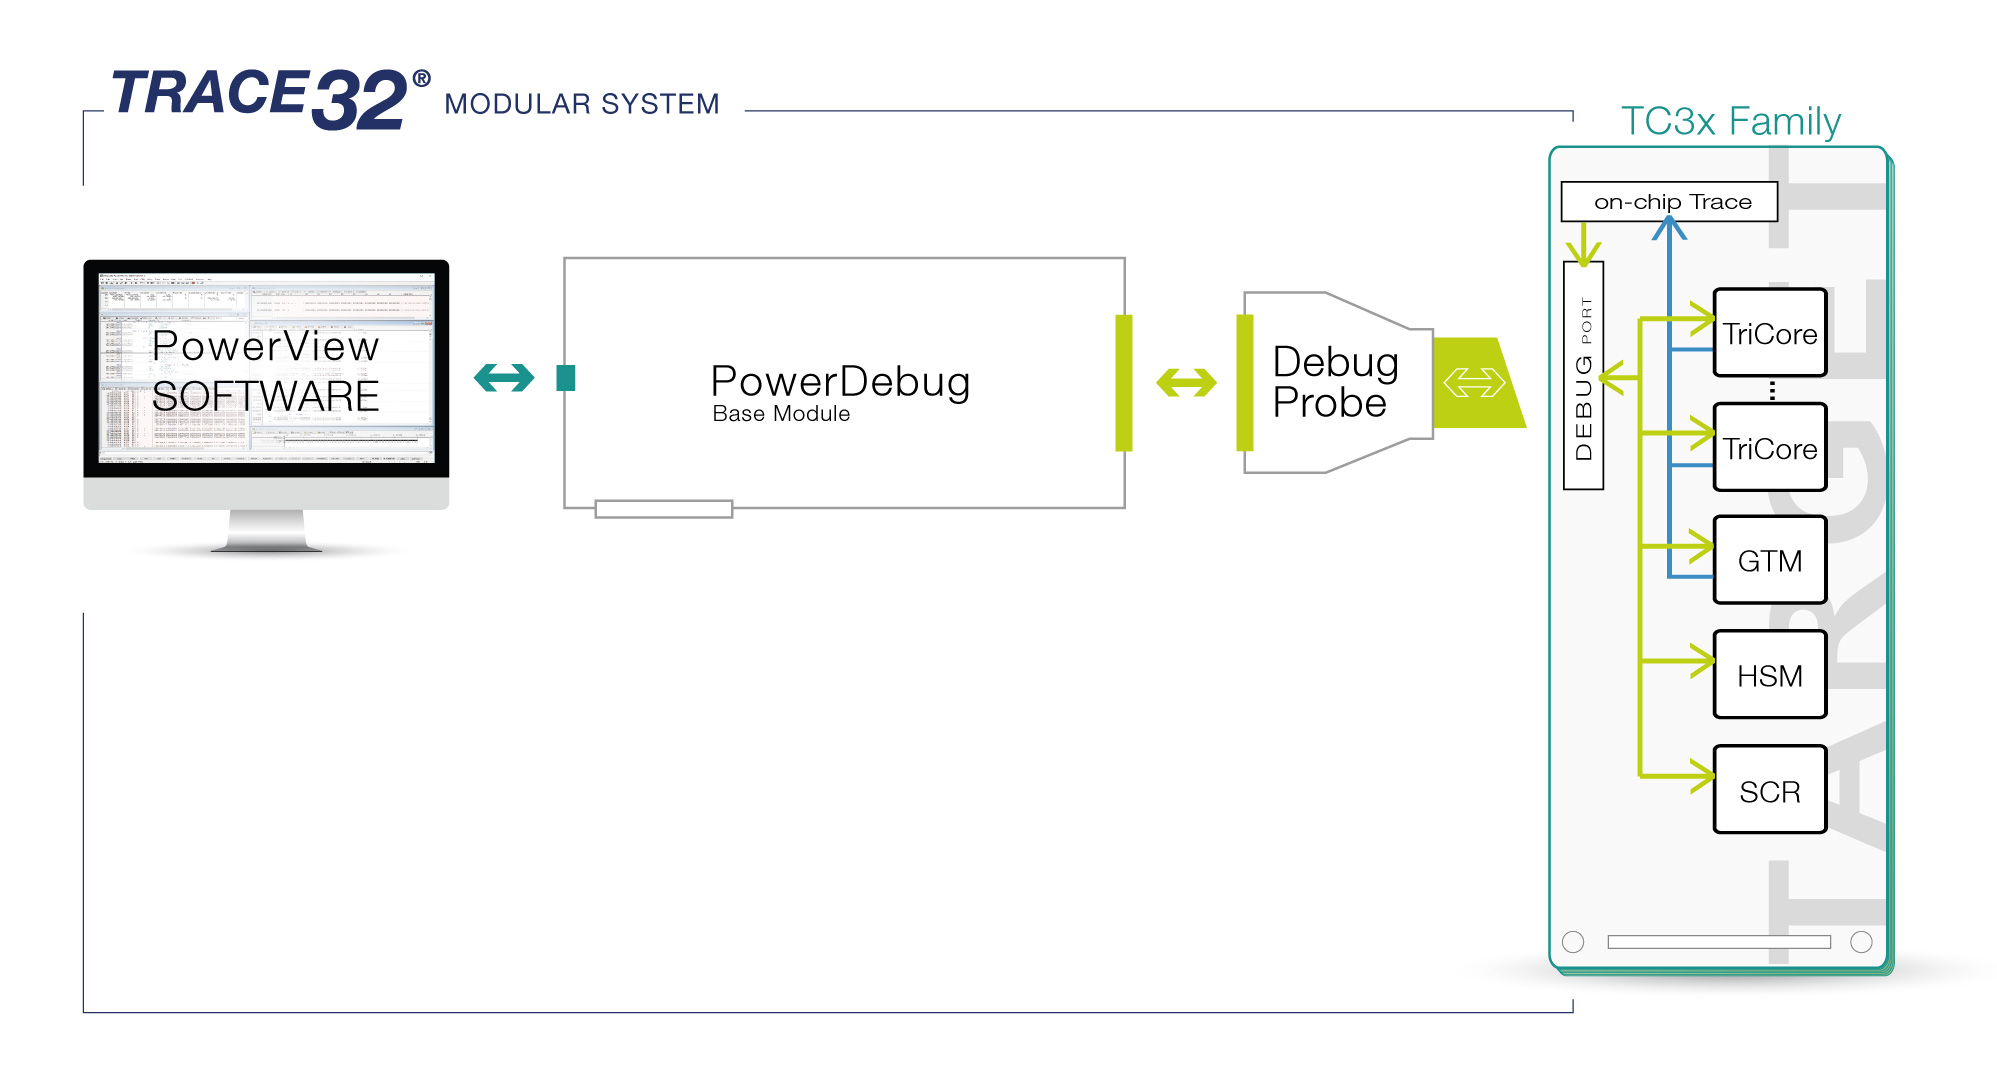
Utilizing All Debug Features


Learn more about our debug system 
TriCore_Debug_tc3x
TriCore_Debug_tc4x

Multi-core Debugging

Gain full control over every core in your TriCore based design, all from a single powerful, flexible tool. Debug applications running in SMP, AMP or a combination of both, including all auxiliary cores such as PCP, GTM, SCR, PPU, with full synchronization between cores.

Advanced Debug Port

Connect to your TriCore using any of the supported debug protocols, including JTAG, DAP, DXCPL, and DXCM. TRACE32 also supports hardware assisted debug port sharing with other tools such as ETAS ETK, dSpace GSI, or Vector VX1000 as well as a software-based method using XCP. However, or whatever you need to connect, TRACE32 is designed to augment and enhance the debug process.

Powerful Features

Take advantage of virtualization support on TC4x and debug all levels of a hypervisor-based system from a single tool.

Seamlessly debug through reset and discover the reason for system crashes with all debug settings automatically re-instated (e.g., breakpoints, trace configuration, etc.).

Innovative Cache Analysis

Display memory, code, and variables in a cache aware format. Sections can be highlighted to indicate caching level. TRACE32 can display cached or non-cached values as well as provide in-depth cache analysis showing valid bits, dirty bits, and LRU information for each cache line.

AUTOSAR Aware Debugging

TRACE32 seamlessly integrates into the AUTOSAR development methodology for the classic platform. System information is extracted from the ORTI file and TRACE32 is fully aware of all aspects such as ISRs, Runnables, Tasks, etc.

TRACE FEATURES

Powerful Trace Tools

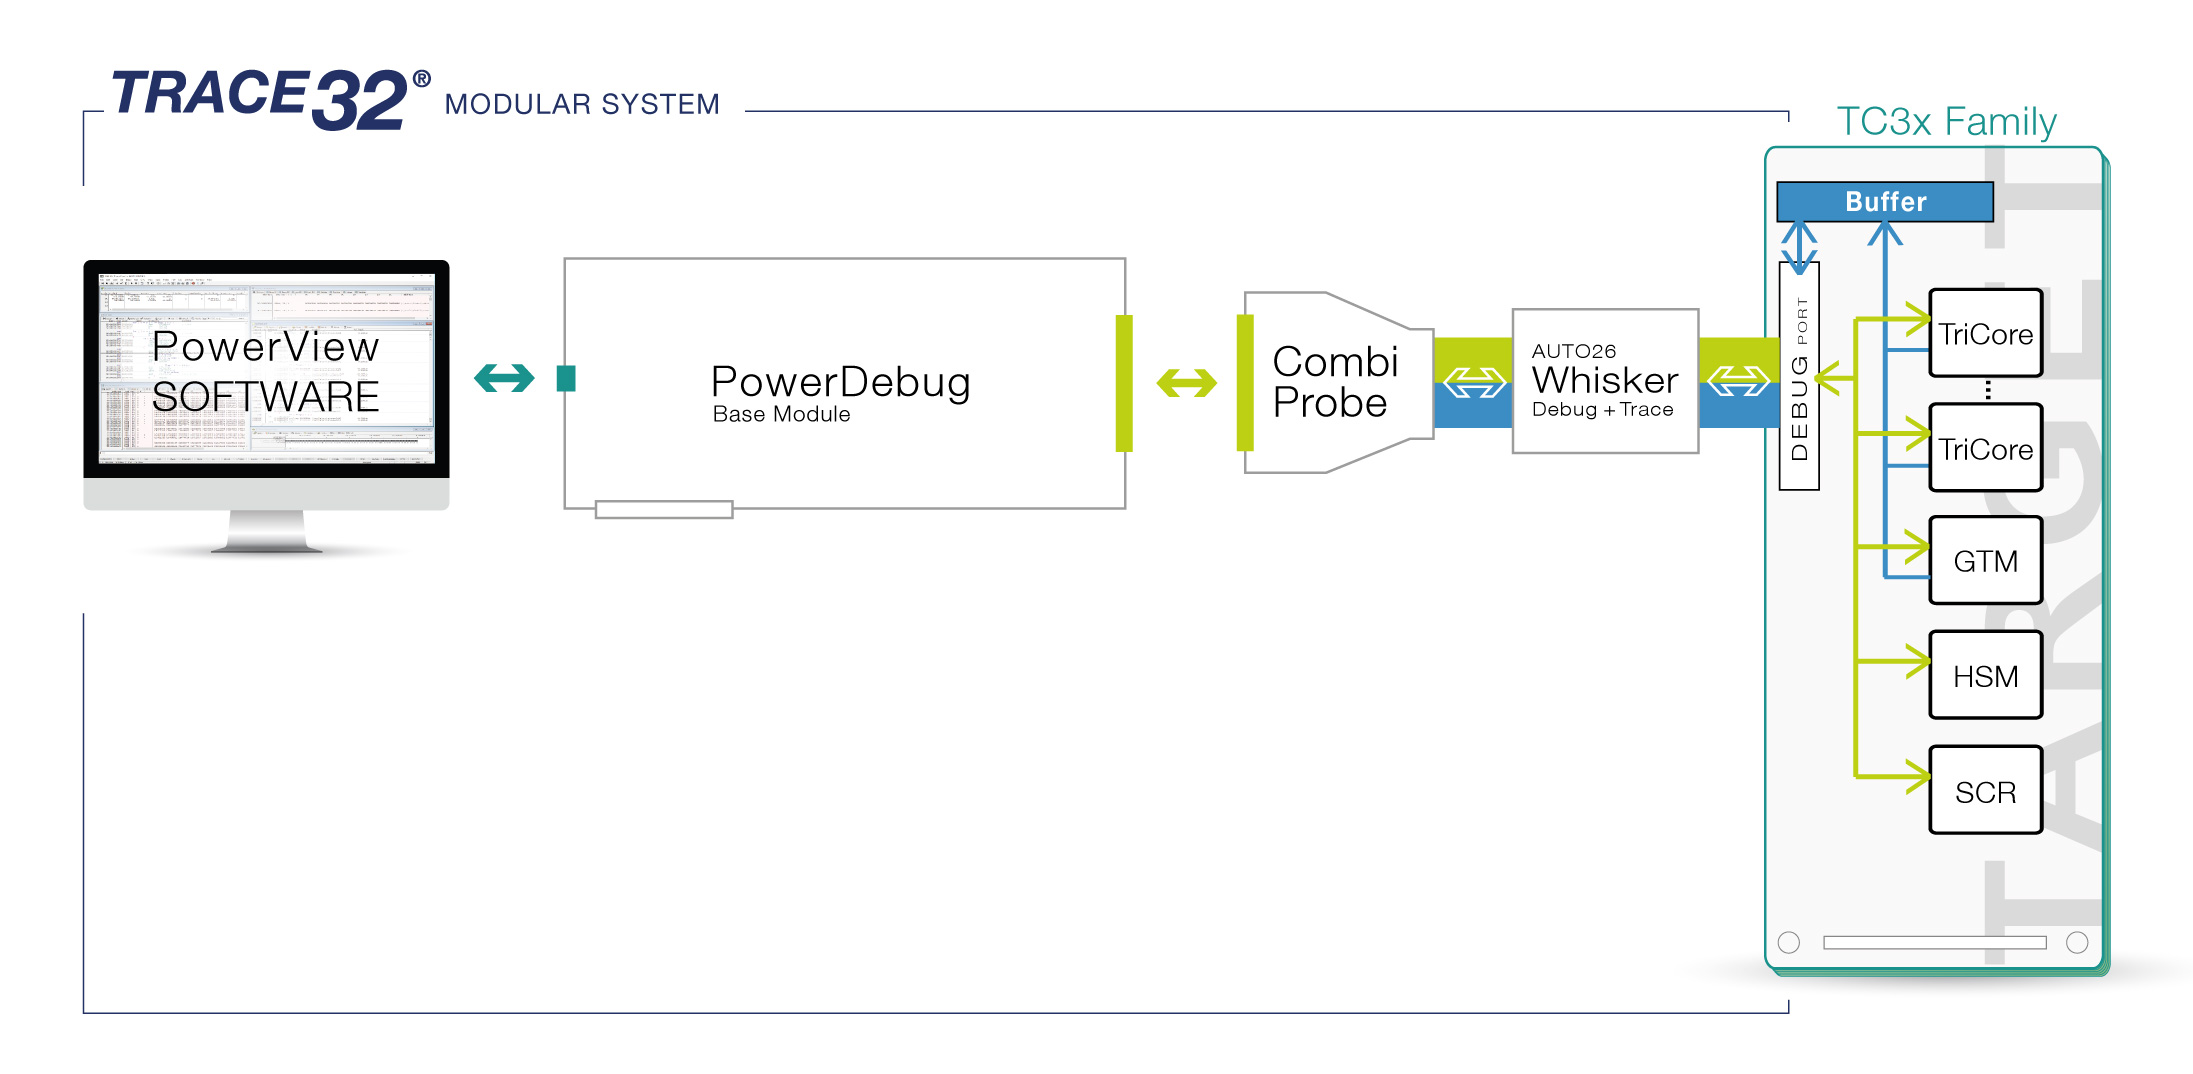
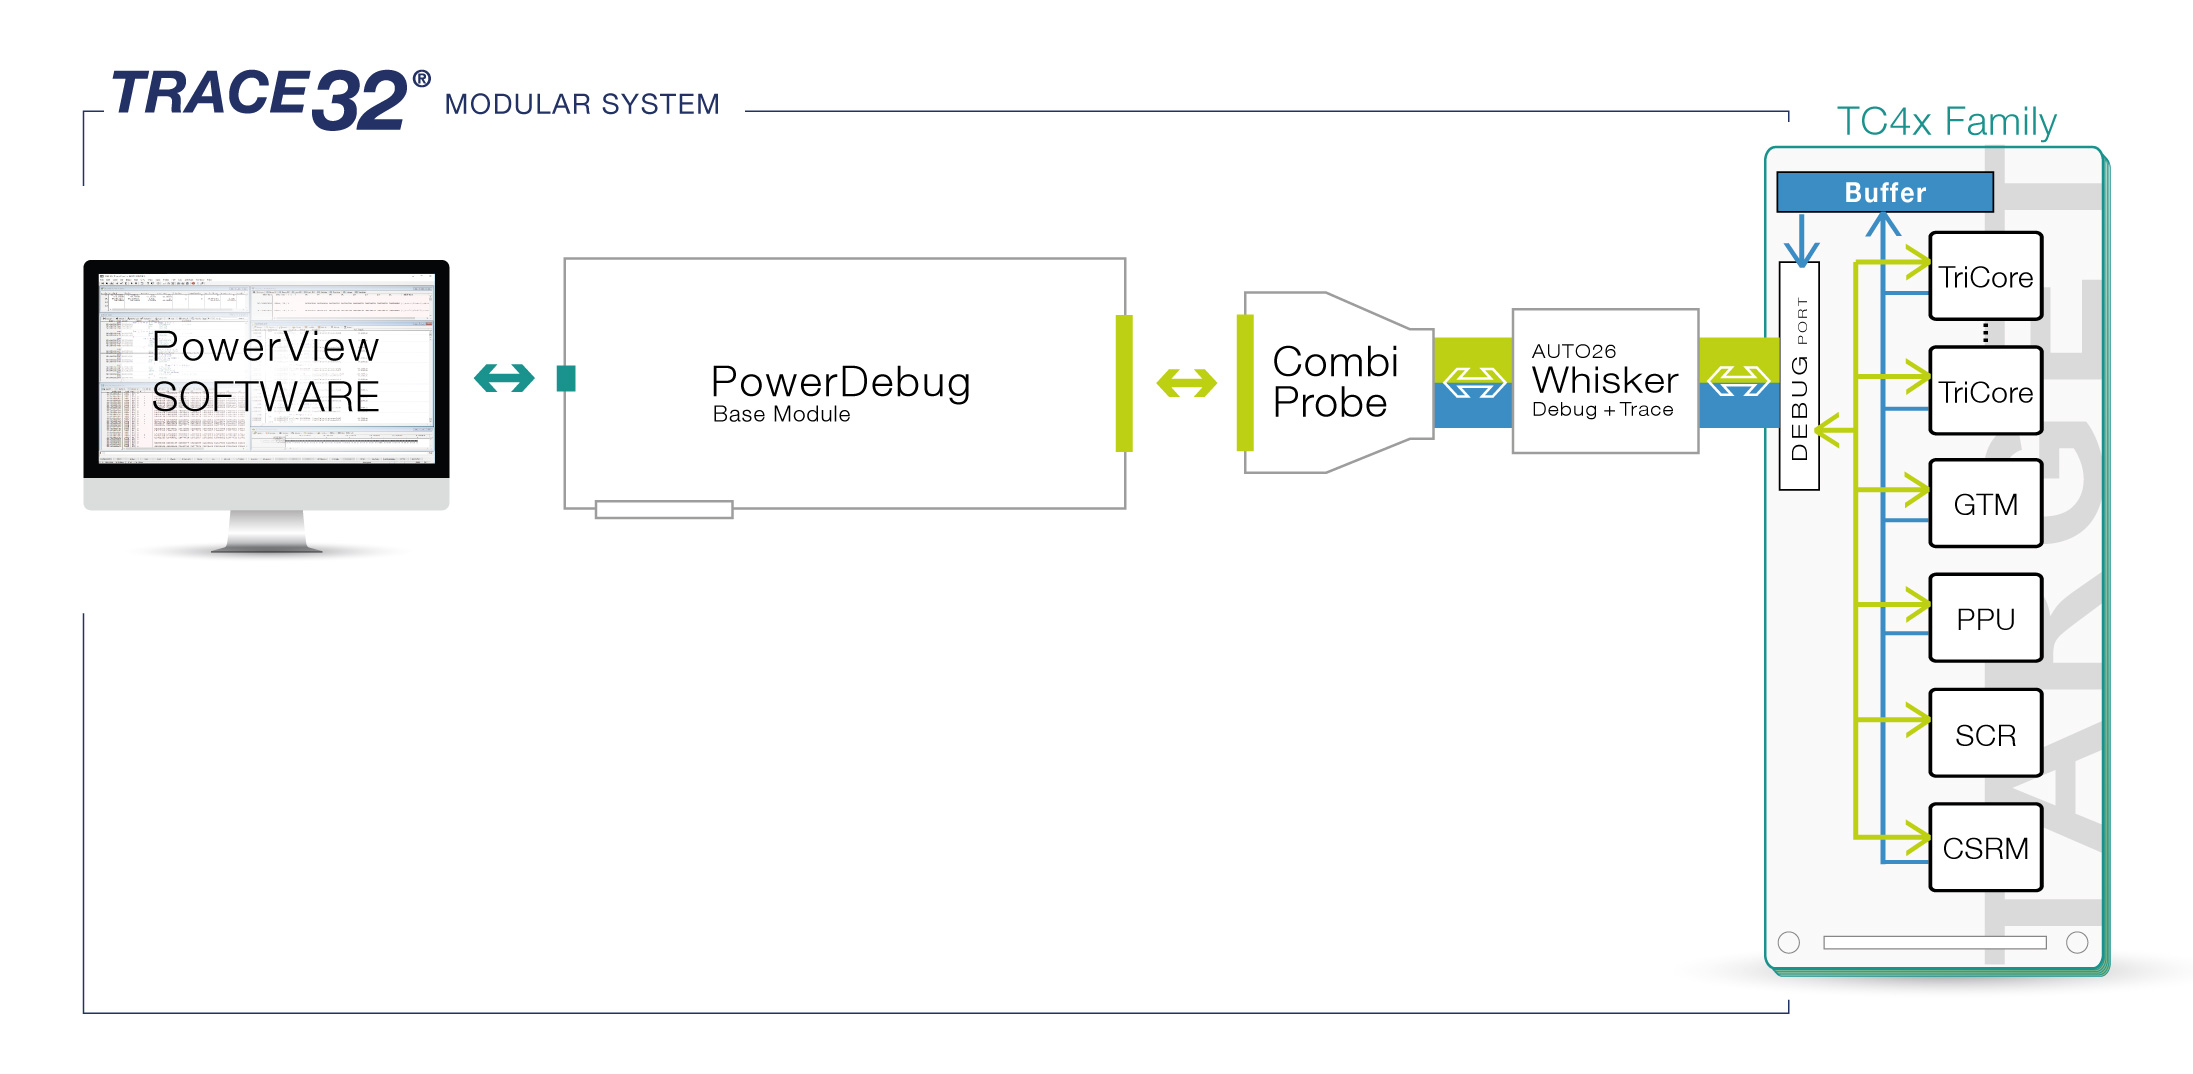
TriCore Emulation Devices are capable of providing trace information, such as program flow or access cycles. This data is generated non-intrusively by the TriCore device and can be sent to local (on-chip) trace memory or streamed off-chip via a high-speed serial trace port; either Aurora Gigabit Trace (AGBT) or Serial Gigabit Trace (SGBT). As well as providing trace for the main TriCore core(s), trace is also available from the subsidiary cores GTM, PPU, and PCP and selected on-chip engines and controllers. This trace information is timestamped and provides incredible levels of detail for analysis of all aspects of your target system.
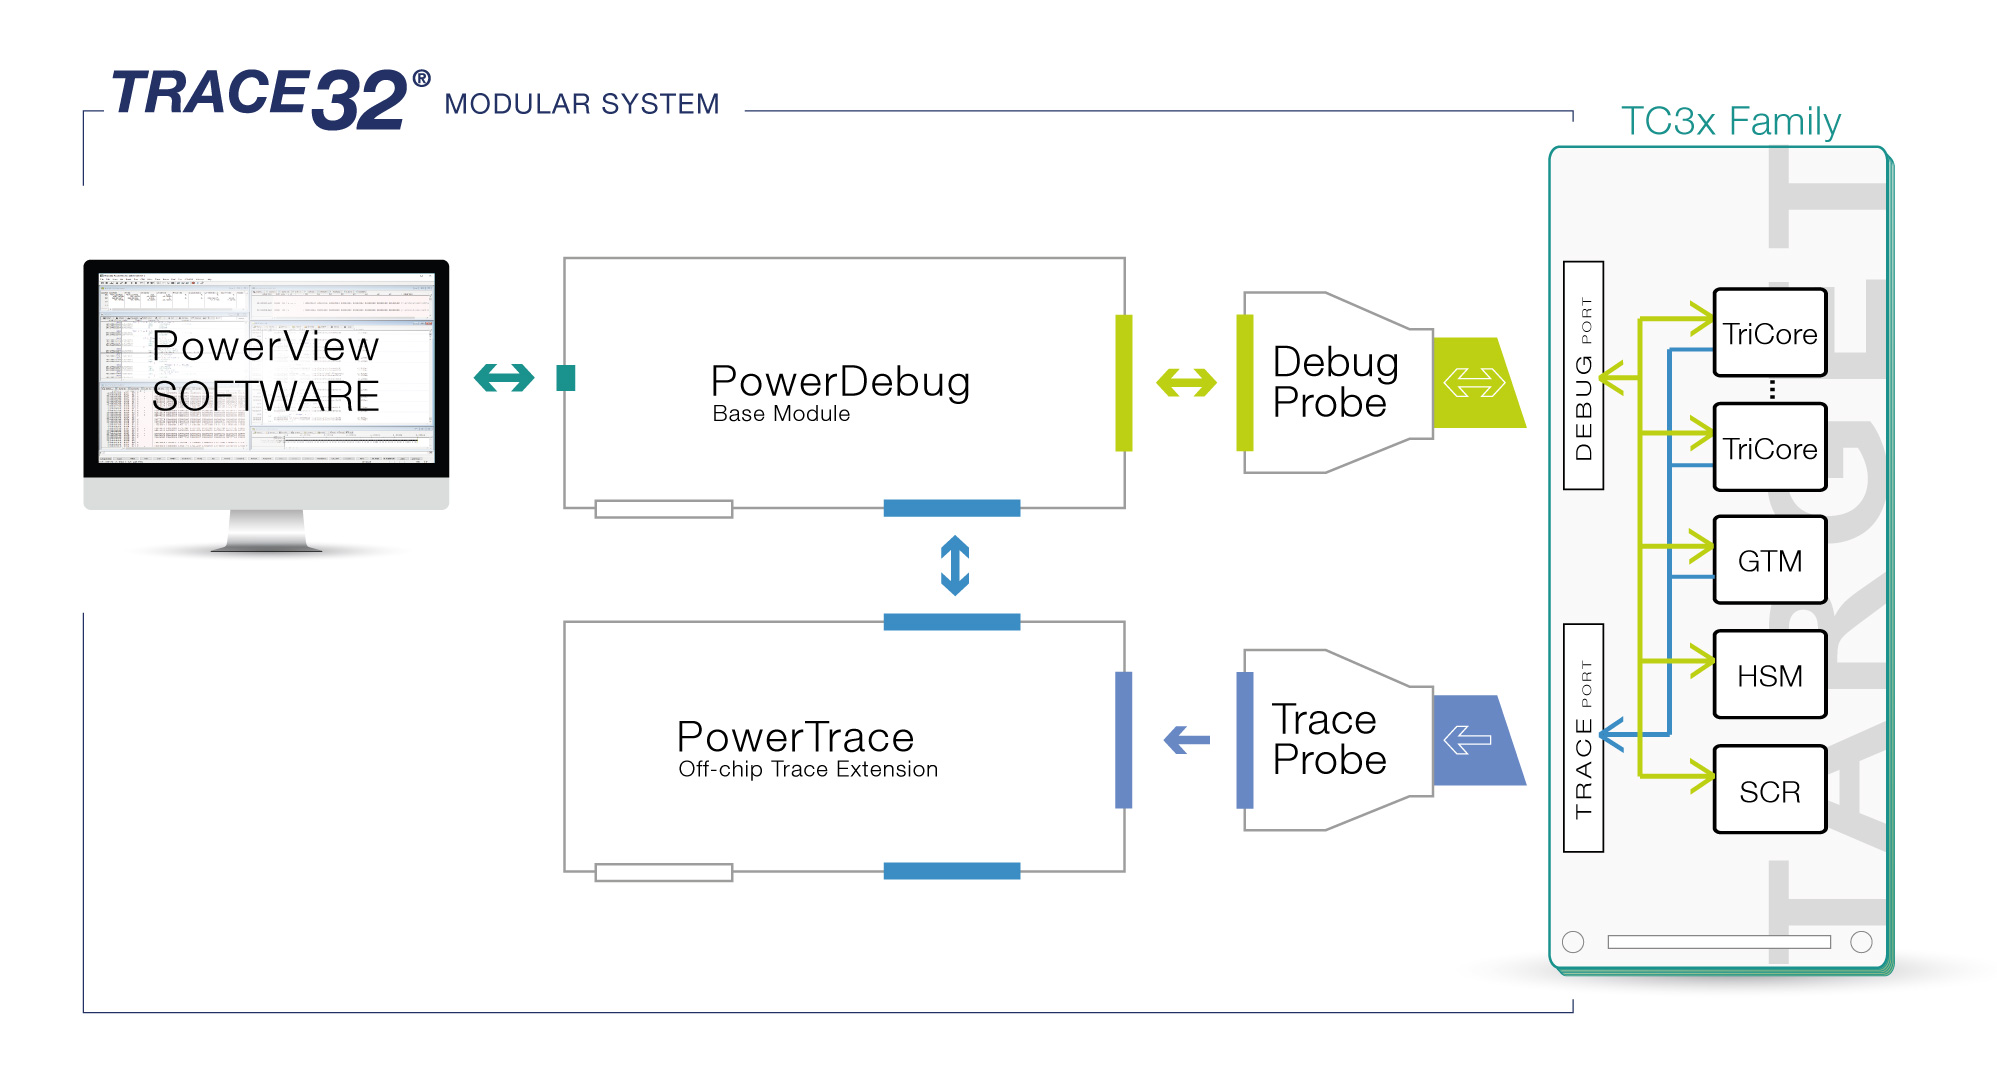
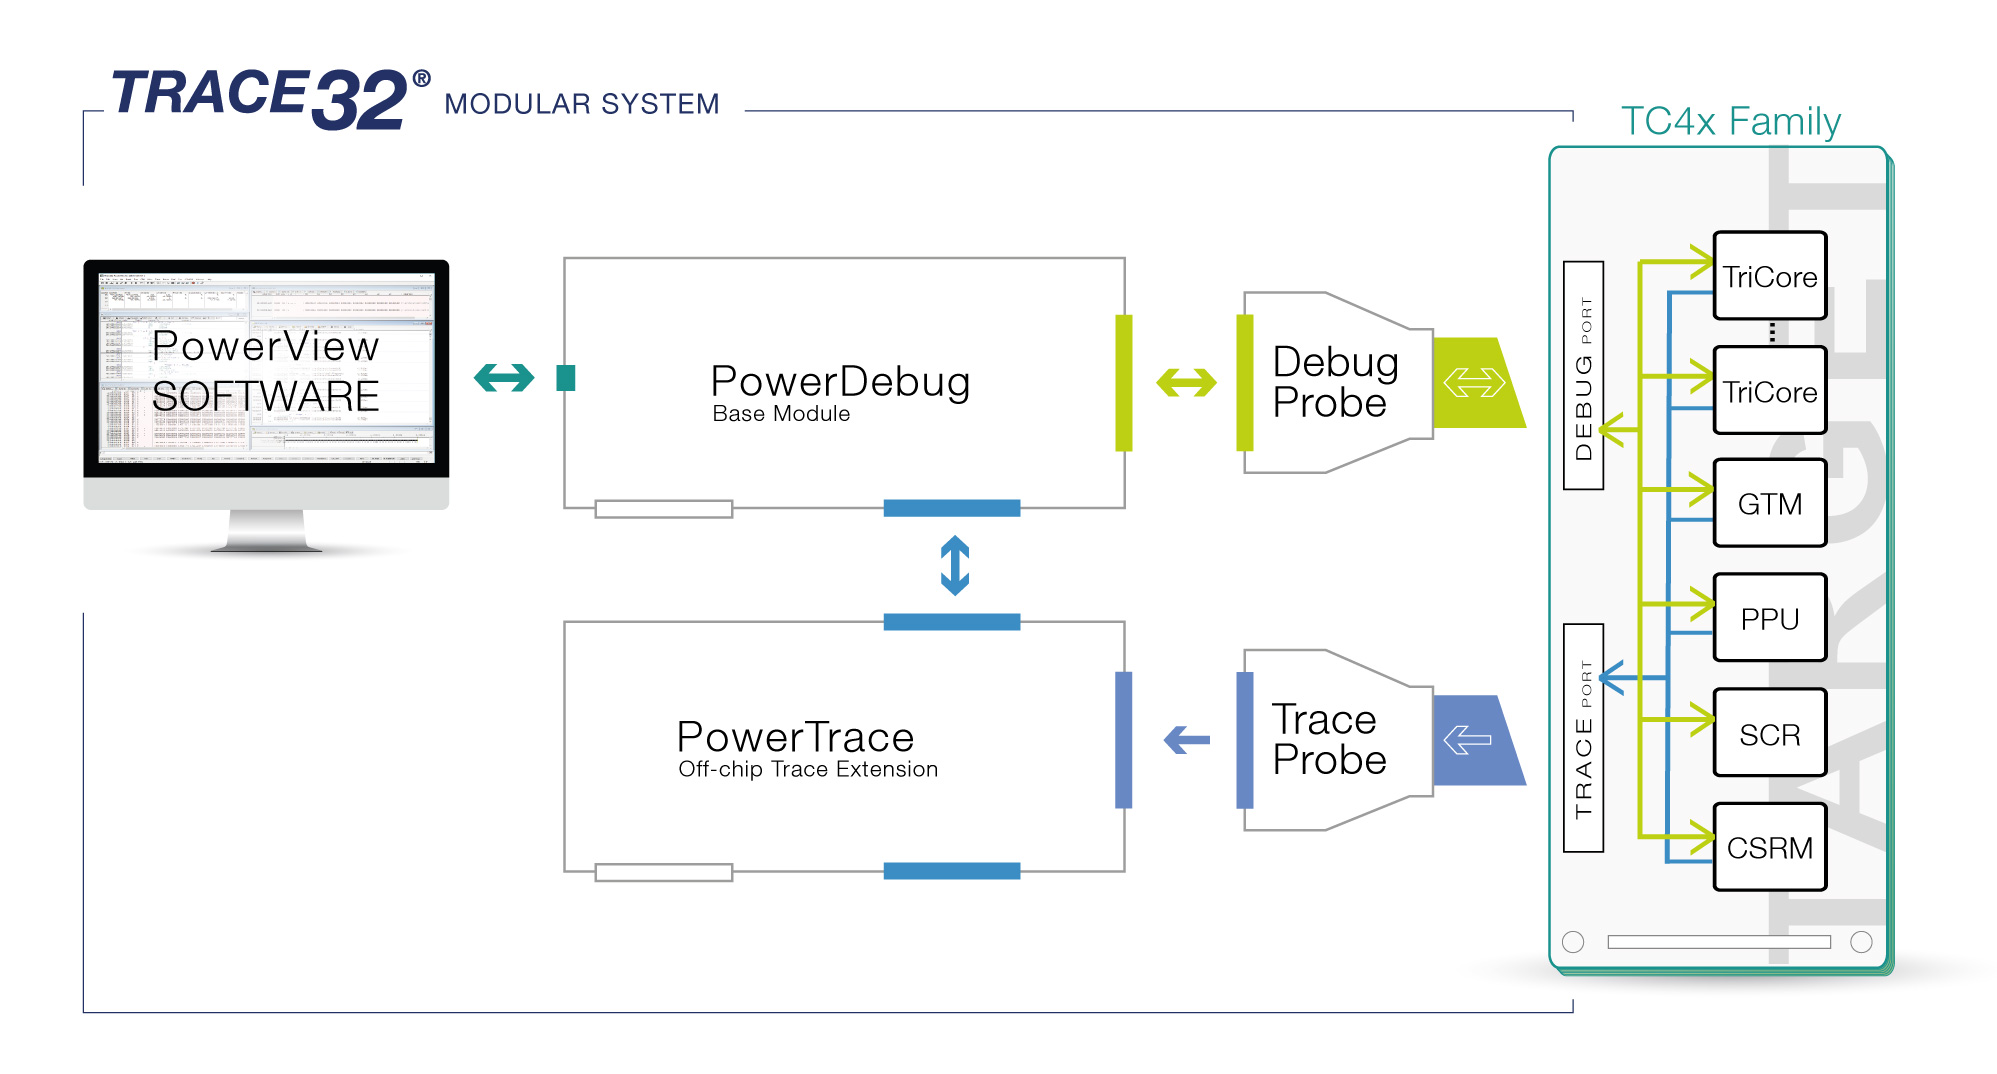
Learn more about our trace system  

TriCore_Trace_tc3x
TriCore_Trace_tc4x
TriCore_CombiProbe_tc3x
TriCore_CombiProbe_tc4x

Multi-Core Trace

The MCDS module of your TriCore device can trace program flow and data accesses for up to 6 cores simultaneously, as well as transfers on the on-chip buses and transfers from the buses.

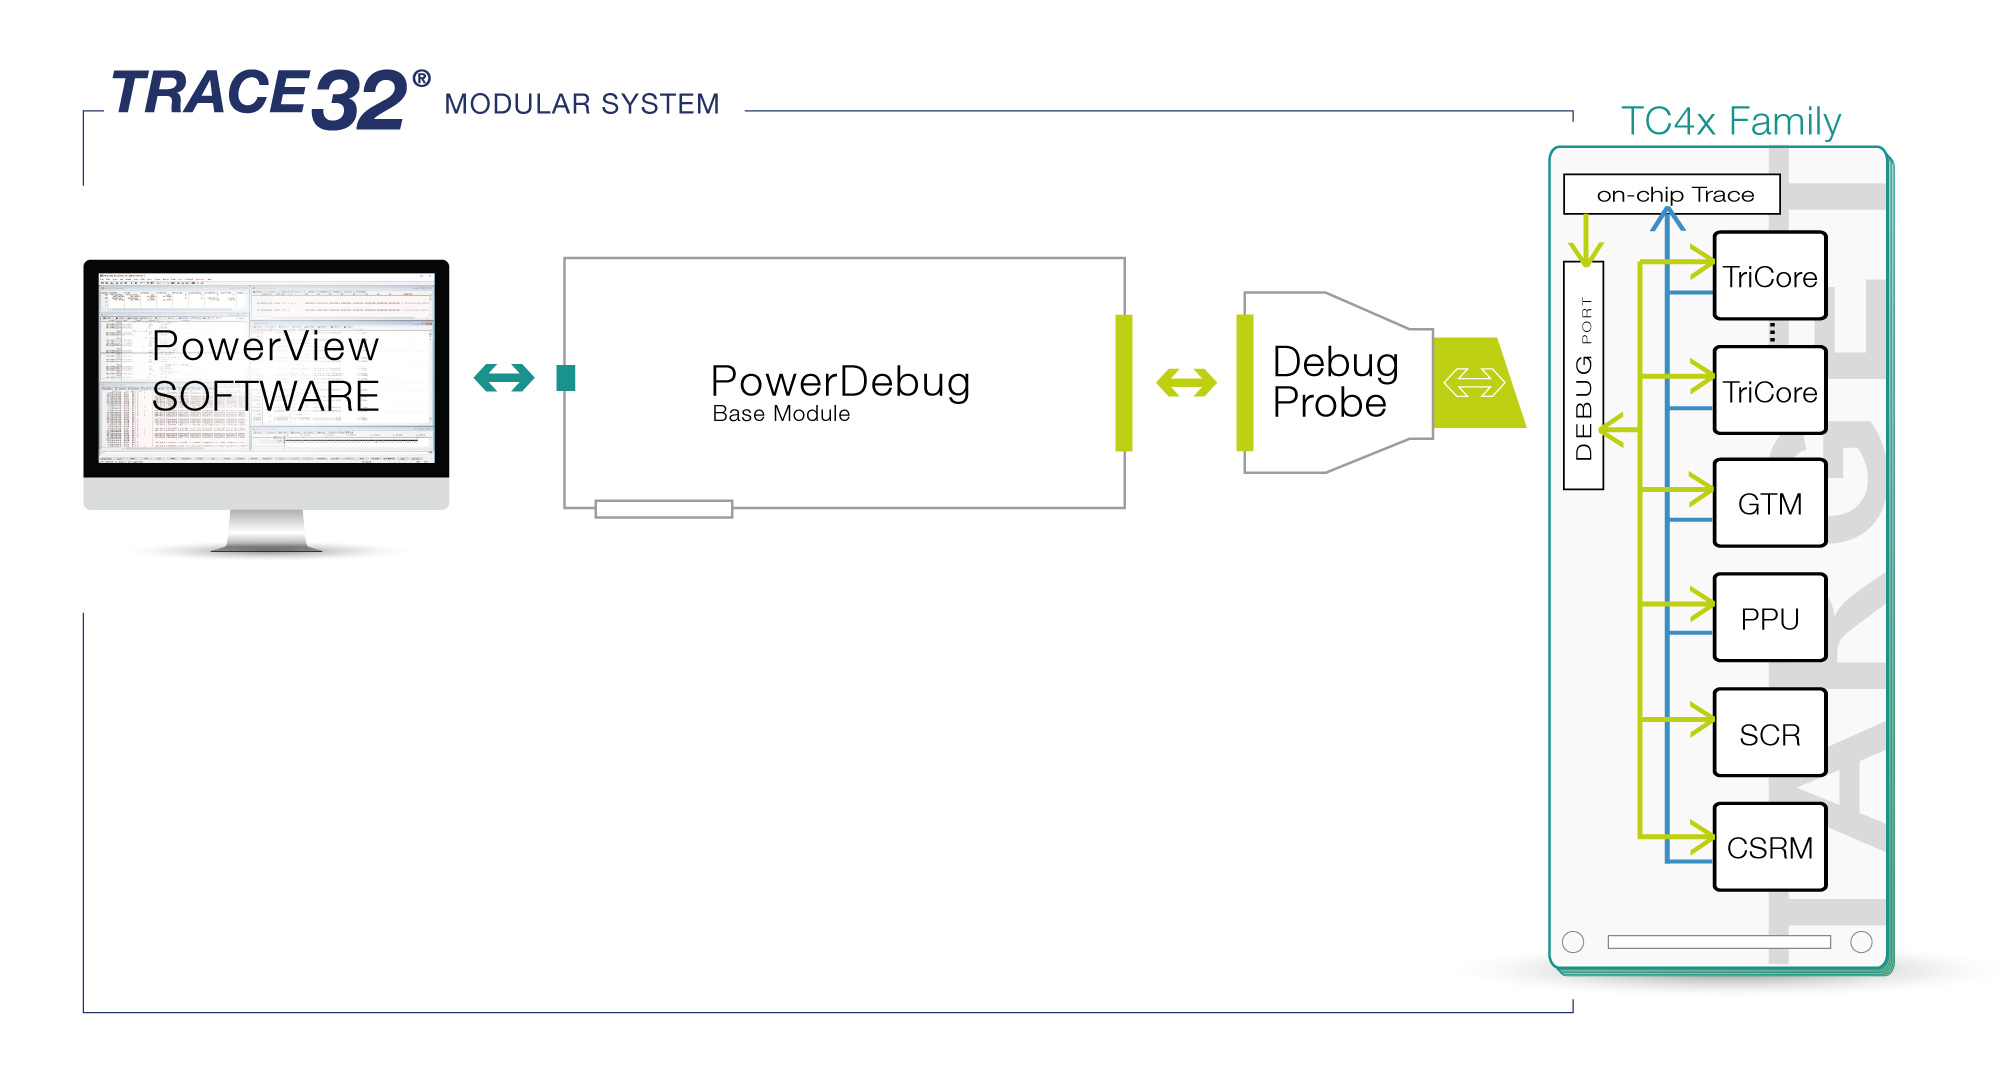
On-Chip Trace

Trace program flow and data accesses for up to 6 cores in parallel as well as transfers on the on-chip buses and transfers from the buses. The data is generated by the MCDS or miniMCDS and is stored in dedicated on-chip memory and the buffer size is generation dependent. This trace buffer is accessed via the standard debug interface, requiring no additional hardware.

Off-Chip Trace

You can sample that same MCDS generated trace data for longer periods using the larger buffers provided by using an off-chip trace tool. Taking advantage of the high-speed Aurora Gigabit Trace Port (AGBT), the data is whisked off-chip and stored in tools with up to 8GBytes of trace buffer memory.

DAP Streaming

Both a filtered MCDS trace or a Compact Function Trace (CFT) can be streamed off-chip via the DAP interface, even whilst the core is still executing code. This provides enough bandwidth for AUTOSAR-aware profiling. DAP Streaming is supported by the CombiProbe 2 family of tools.

AUTOSAR Aware Profiling

Easily capture data from your AUTOSAR classic platform, allowing you to profile every aspect of the application. Excellent cross-tool support for both ORTI and ARTI standards ensures your trace data can be exported to a number of third-party analysis tools for specific requirements.

Complex Trigger Language (CTL)

Create precisely targeted triggers and filters to narrow down the focus of your trace: focus in on the areas that matter the most to you; create complex scenarios for when and what to trace. The Complex Trigger Language (CTL) provides a much finer control over what is traced and under what circumstances than the standard start/stop/this/not-this triggering usually associated with a trace. 

Code Coverage for Functional Safety

Simplify your safety certification with code coverage reports, showing a variety of metrics from object coverage to full MC/DC. With our Tool Qualification Support Kit (TQSK), TRACE32 can become a ‘trusted tool’ in your environment, with full traceability back to our TÜV Nord certification.


SOFTWARE DEBUGGERS

Get Ready Before Your Silicon is

You have a wide choice of debug options for your TriCore based system. Some of these may include software only debuggers, such as those outlined here.

Software licenses require a working Reprise License Manager or access to a cloud-based license server. More information about this can be found here.
TriCore_XCP_tc3x
TriCore_XCP_tc4x

Instruction Set Simulator

If you need to develop application code in parallel to your hardware being developed, you can start testing and debugging on an instruction set simulator. The simulator allows you to run code, provide virtual tracing or program flow and data accesses as well as an API to create your own peripheral plug-ins. For applications that need safety certification, a certified simulator is available and works with our TQSK.

Debugging via XCP

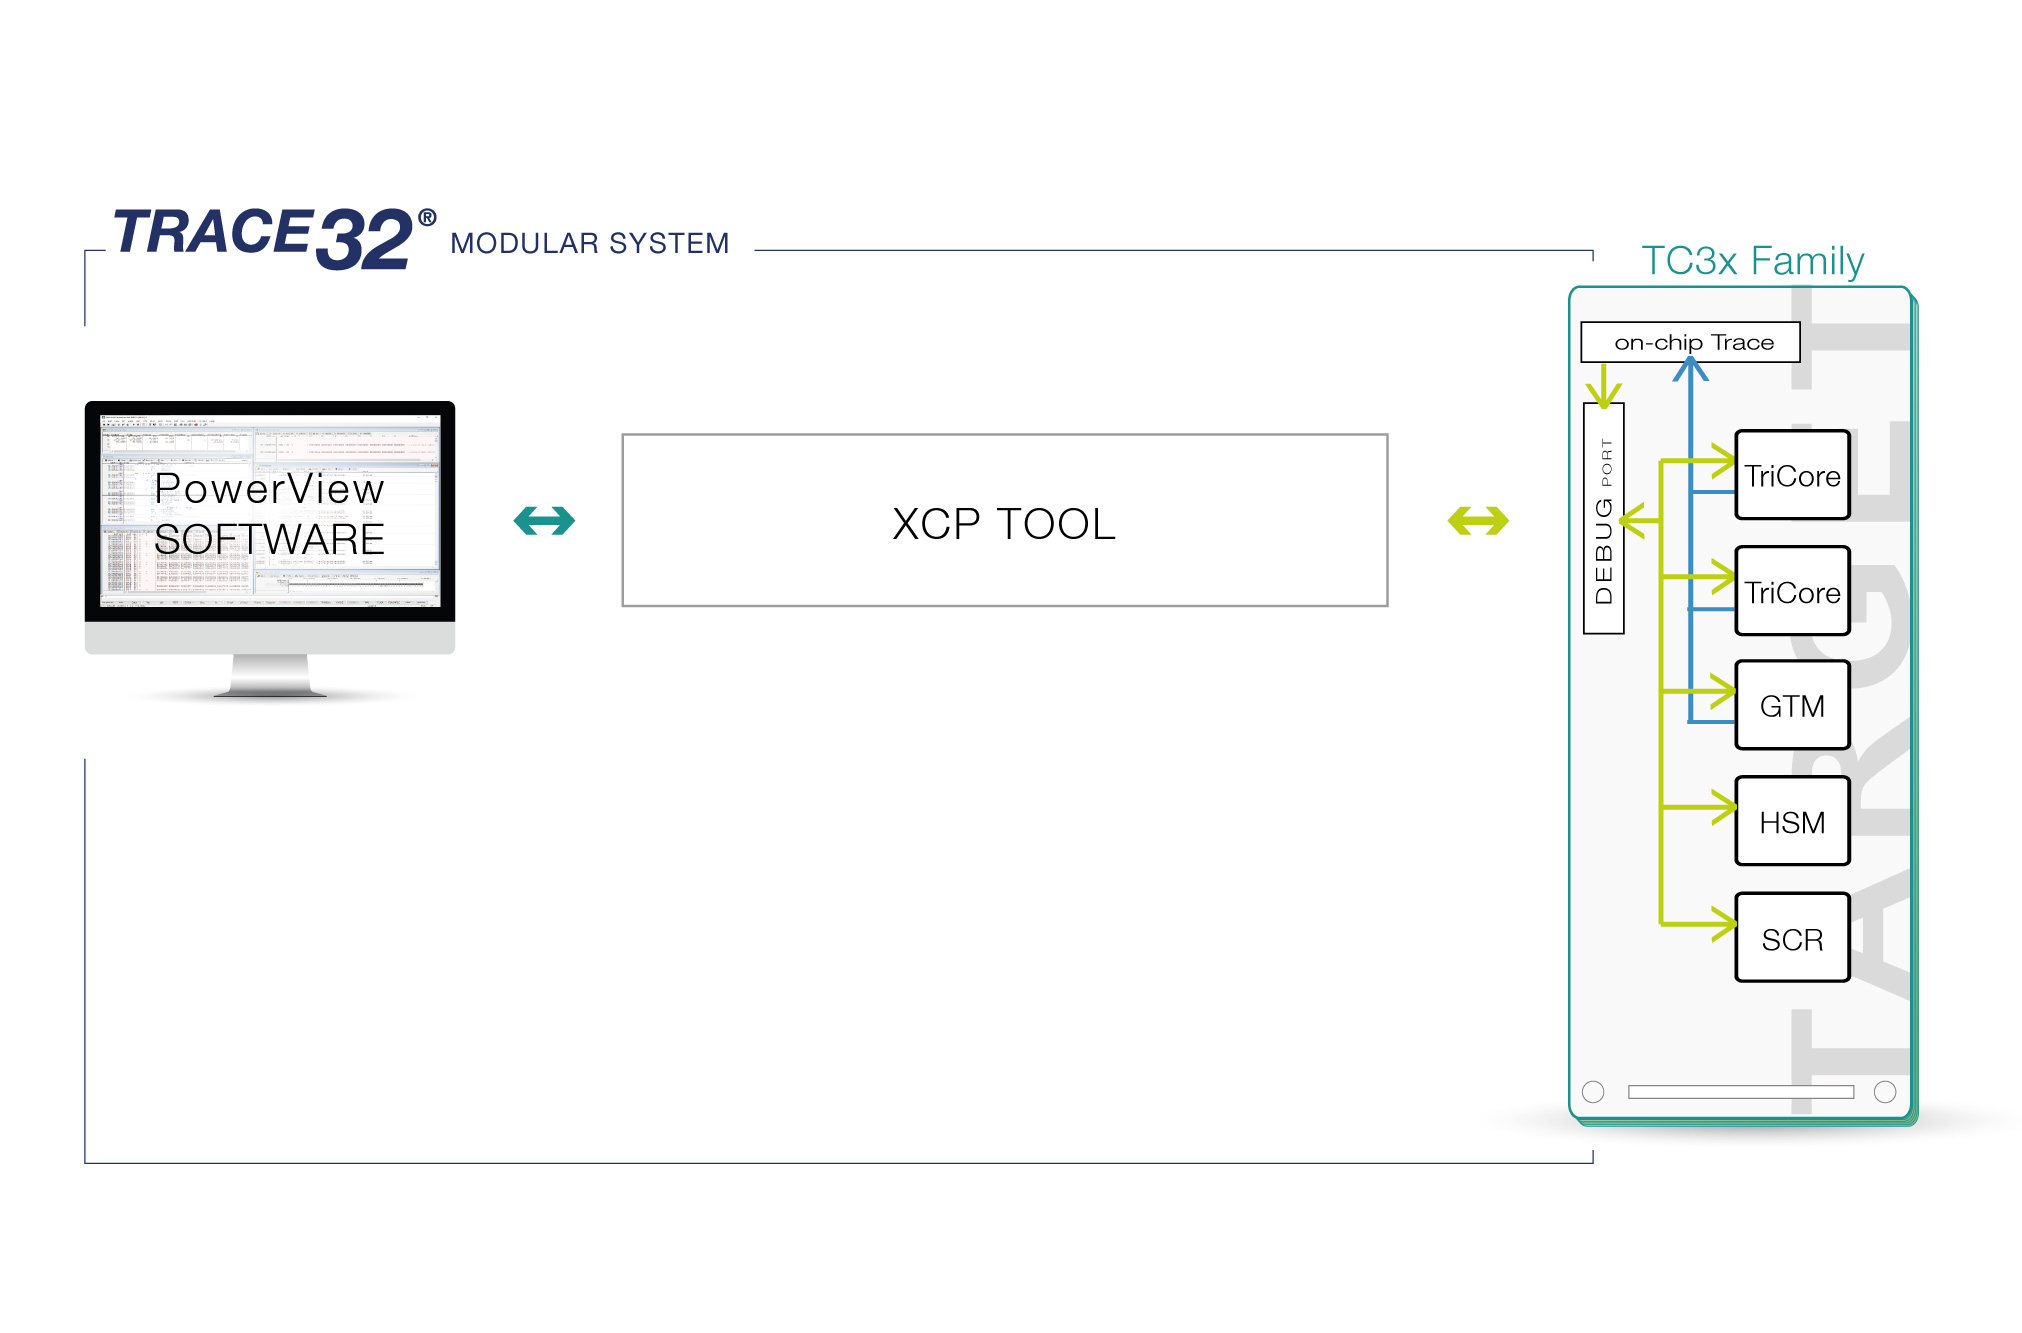
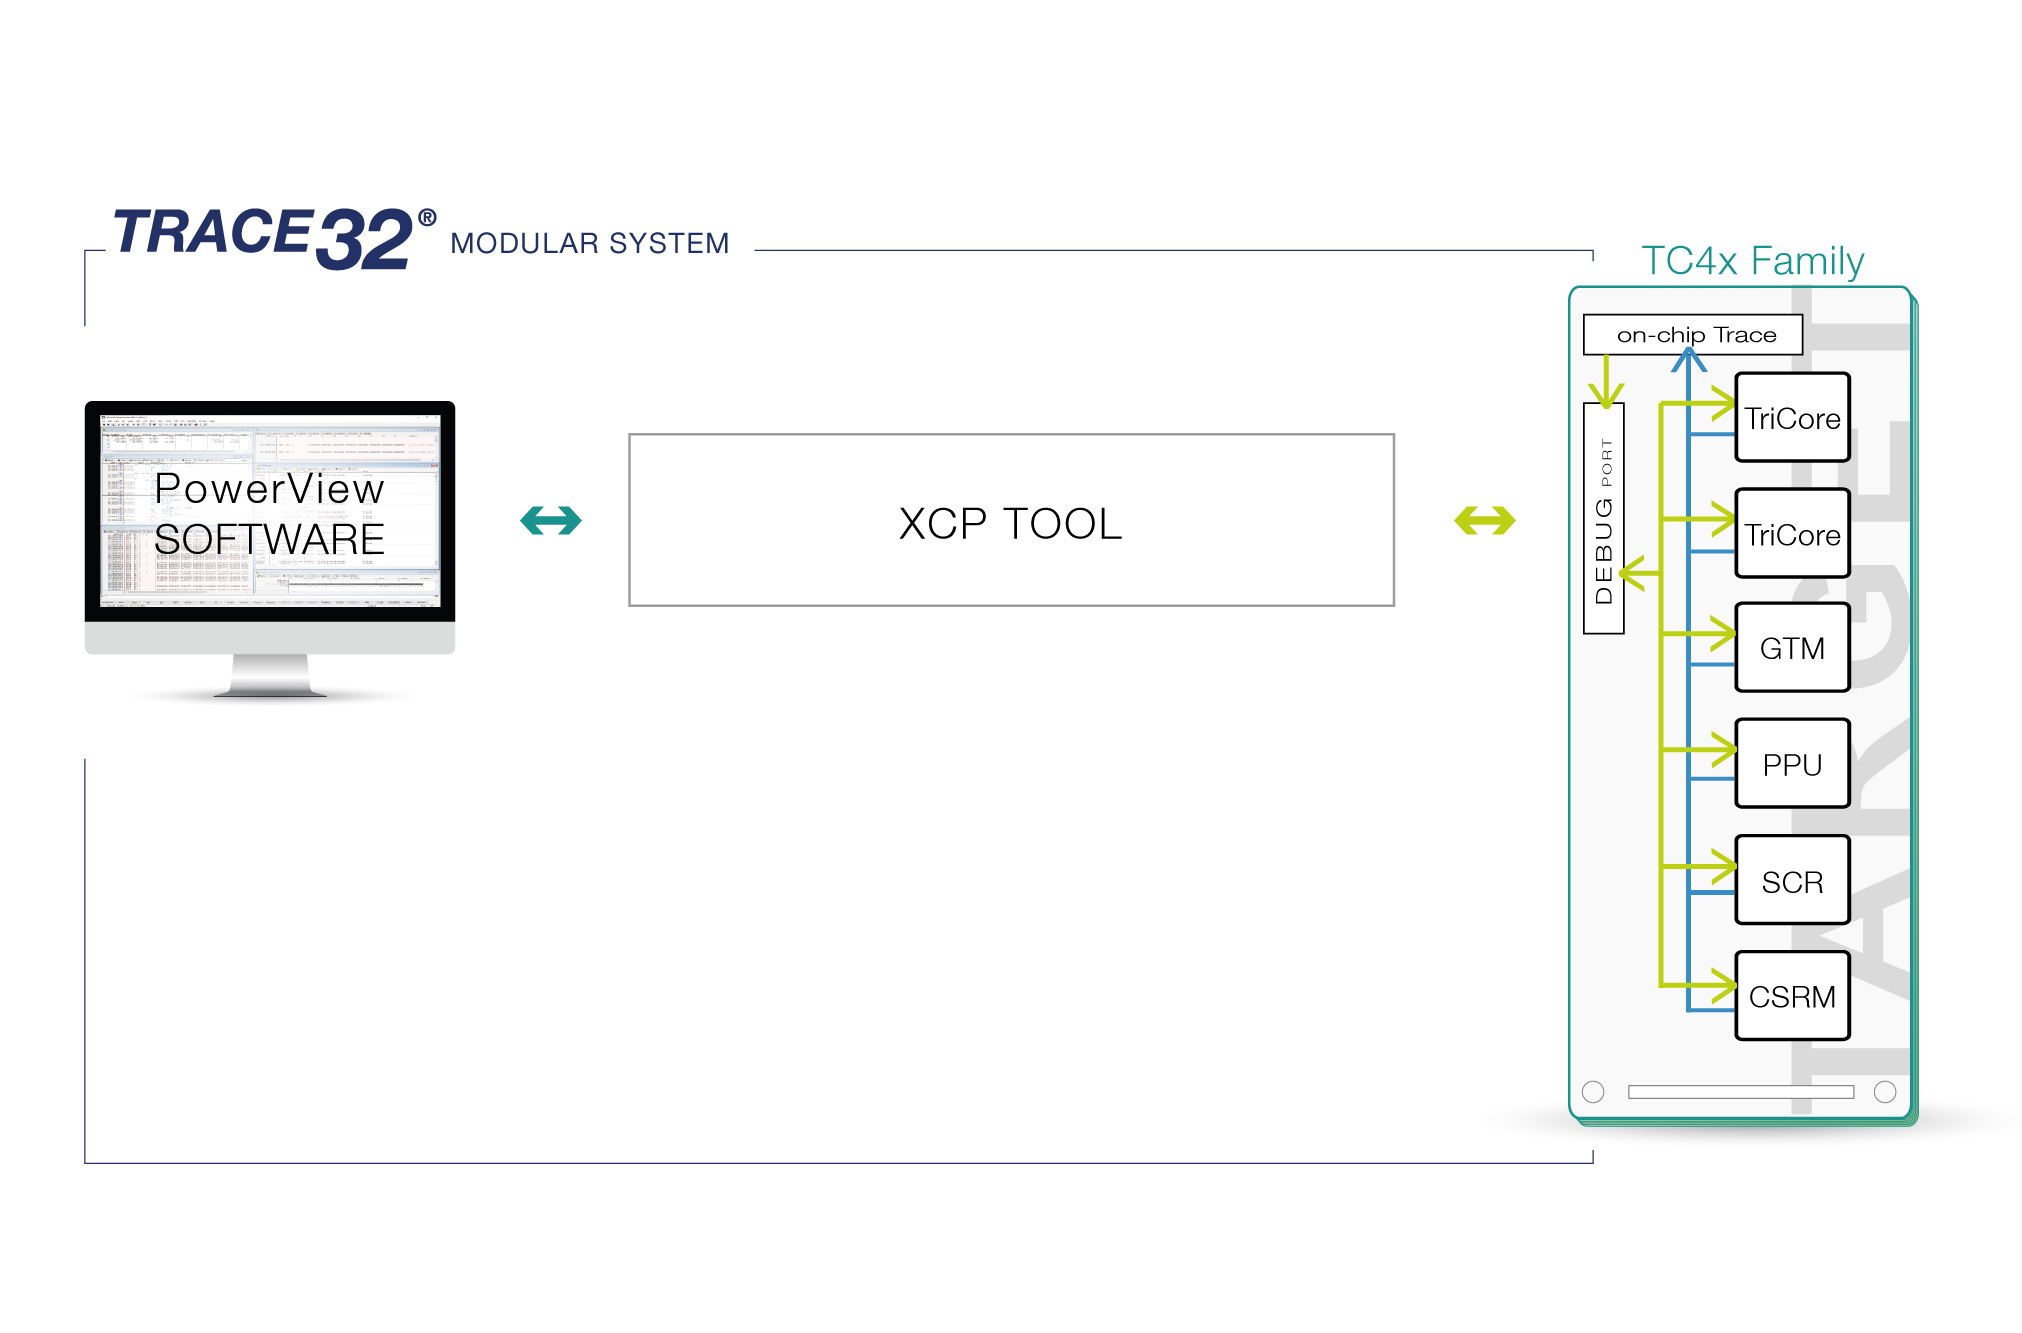
The XCP (Universal Measurement and Calibration Protocol) Protocol family allows control of measurement and calibration tools from multiple vendors. This is a two-layer protocol with XCP being layered on top of a transport layer such as TCP, CAN, or FlexRay amongst others. It provides a basic set of features with vendor or target specific extensions.

TRACE32 can connect to a third-party tool that supports XCP, allowing both tools to share a JTAG or DAP interface to a TriCore target. An example can be seen in the diagram below.

TRACE32 supports software debugging over XCP according to ASAM MCD-1 Specification, from v1.5 onwards and the ETAS proprietary protocol extensions.

Processor in the Loop Simulation (PIL)

If your development environment uses a modelling system where you need Processor in the Loop Simulation, this can be achieved by adding a license to your TriCore debug probe. If your setup can also make use of Simulator in the Loop (SIL), then you can use our TriCore Instruction Set Simulator for this.

For PIL, please add LA-2900X to your TriCore debug probe.

For SIL, please use add LA-2900L. This requires a working RLM license manager or a cloud-based license server.

Virtual Targets

Application code and algorithms can be tested and refined using a variety of TriCore based virtual targets. TRACE32 allows you to work on your Virtual Targets with the same familiar set of tools and user interface as your real-world hardware. There is no need for additional training, meaning you get up to speed immediately and can be productive right from day one.

Work with any Virtual Target which uses the Multi-Core Debug API (MCD) supporting both debug and trace or GDB for debug. Simple integration with 3rd party tools such as Synopsis Virtualizer and VDK and ASTC VLAB Works.

TOOLCHAIN SUPPORT

3rd Party Tools Supported for TriCore

Compiler (4)
Product
Company
Language
DIAB
C, C++
GCC
ASM, C, C++
GREENHILLS
C, C++
VX-TC
ASM, C, C++
Simulators, Emulators and Virtual Targets (7)
Product
Company
COMET and METEOR
FETK, XETK
GDB
VIRTUALIZER and VDK
VLAB Works
VX1000

The following features are available for all architectures supported by TRACE32. Please contact us if your device or tool is not listed here; support is often already on its way.

Host OS

Our debug software runs on all major operating systems.

Flash Devices

We support the programming of a large variety of flash devices. NOR, NAND, SPI, QSPI, EMMC and more.

3rd Party Integrations

Integrations allow you to easily use TRACE32 with other tools.

RELATED PRODUCTS

TRACE32 Related Products for TriCore

Filter by

Filter by