CEVA-X Debug & Trace Solutions
Any CEVA-X Core in Any SoC
Benefit from Lauterbach’s leading edge development tools and close partnership with CEVA® to analyze any design, from a stand-alone single- or multi-core device to a complex SoC.
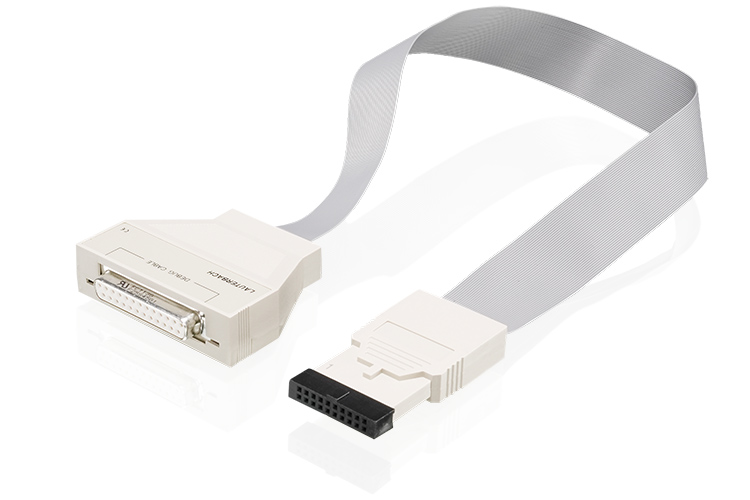
CEVA-XTM DSP cores are a popular choice for multi-gigabit baseband network processing, machine vision, deep learning, and wireless applications. Using our TRACE32® tools you can debug and control any CEVA-XTM core (along with all of the other cores) in any SoC via a single debug interface, all at the same time. TRACE32® supports the complete feature set CEVA-XTM cores like CEVA-XCTM, CEVA-XMTM, SensProTM, and many others. For chips implementing Arm’s CoreSight IP, TRACE32® tools support real-time on- and off-chip tracing.
Supported Sub-Architectures
Ceva X16xx, Ceva X1/X2, Ceva BX/XC/XM
Utilizing all debug features
Explore and utilize all the powerful and well-known features of your CEVA-X™ core with Lauterbach debug modules: full on-chip breakpoint support; run-time memory access; flash programming and benchmark counters. And of course, everything is scriptable, enabling you to repeat the same test-sequence over and over. The same interface you use for your application core debug can be used for debugging your DSP, reducing training time and allowing you to be more productive, more quickly.
Learn more about our debug systemCapture Your Core’s Actions
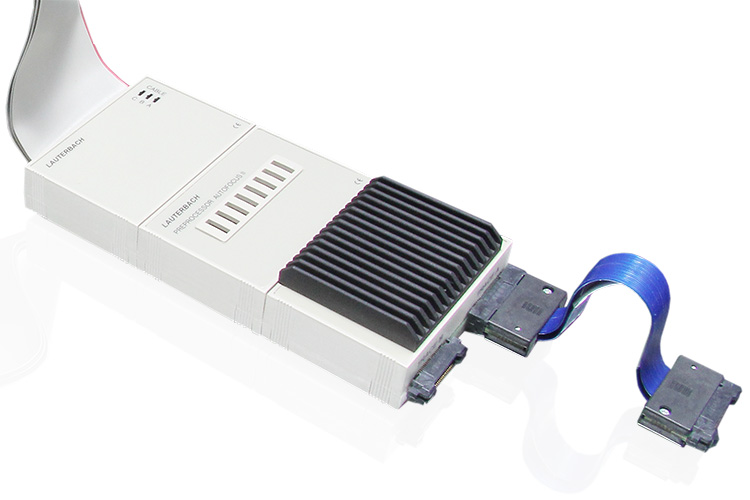
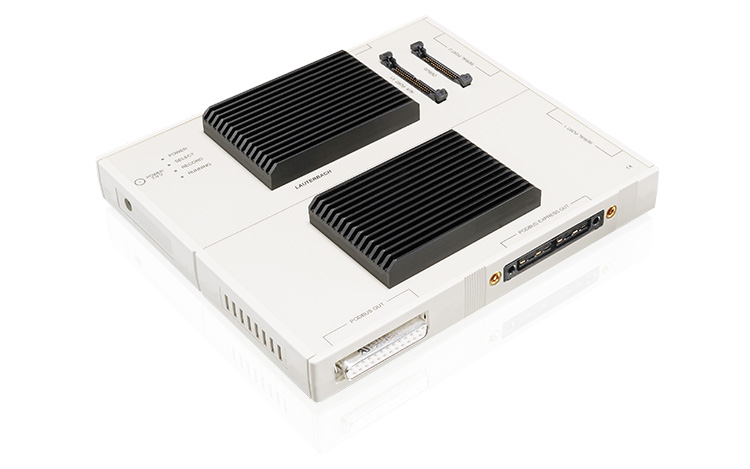
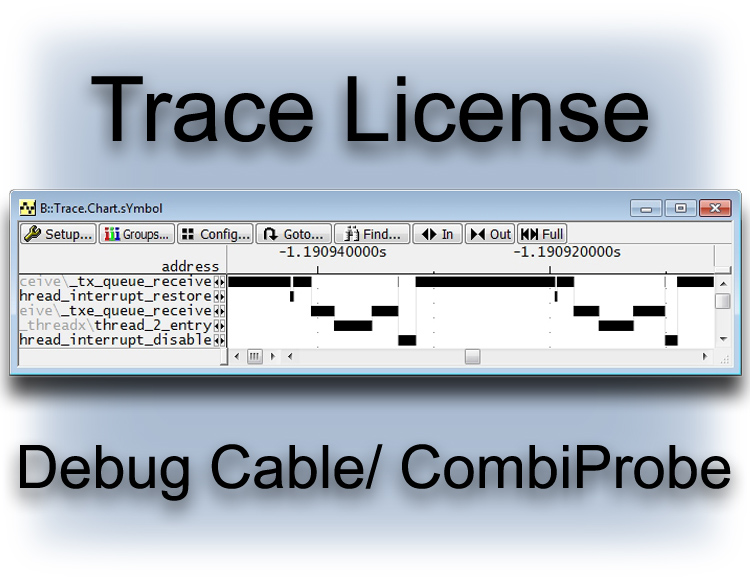
Stop mode debugging can be a powerful tool but tracing is even better. Our trace solutions for CEVA-X™ support both on-chip trace and the much more powerful Arm® ETM® off-chip Trace, which can save the trace-data inside the target memory or emit it to one of our PowerTrace tools. For extended tracing, the ETM off-chip trace provides large volumes of trace data and the capability of recording for minutes, hours, or days using trace streaming.
Get Ready Before Your Silicon is
Test your CEVA-X™ code in your custom SoC before your SoC is ready. Taping out your SoC takes a lot of time but TRACE32® allows you to start software development on simulators, using the same GUI and toolset that you would use later with the real chip.
3rd Party Tools Supported for CEVA-X
The following features are available for all architectures supported by TRACE32. Please contact us if your device or tool is not listed here; support is often already on its way.
Host OS
Our debug software runs on all major operating systems.
Flash Devices
We support the programming of a large variety of flash devices. NOR, NAND, SPI, QSPI, EMMC and more.
3rd Party Integrations
Integrations allow you to easily use TRACE32 with other tools.


