ARC Debugger & Trace

OVERVIEW

Any ARC Core in Any SoC

Benefit from Lauterbach’s leading edge development tools and close partnership with Synopsis to analyze any design, from a single tiny microcontroller to a massive multicore application processor. ARC DesignWare® is a processor IP from Synopsys which can be optimized to fit your System on Chip (SoC).

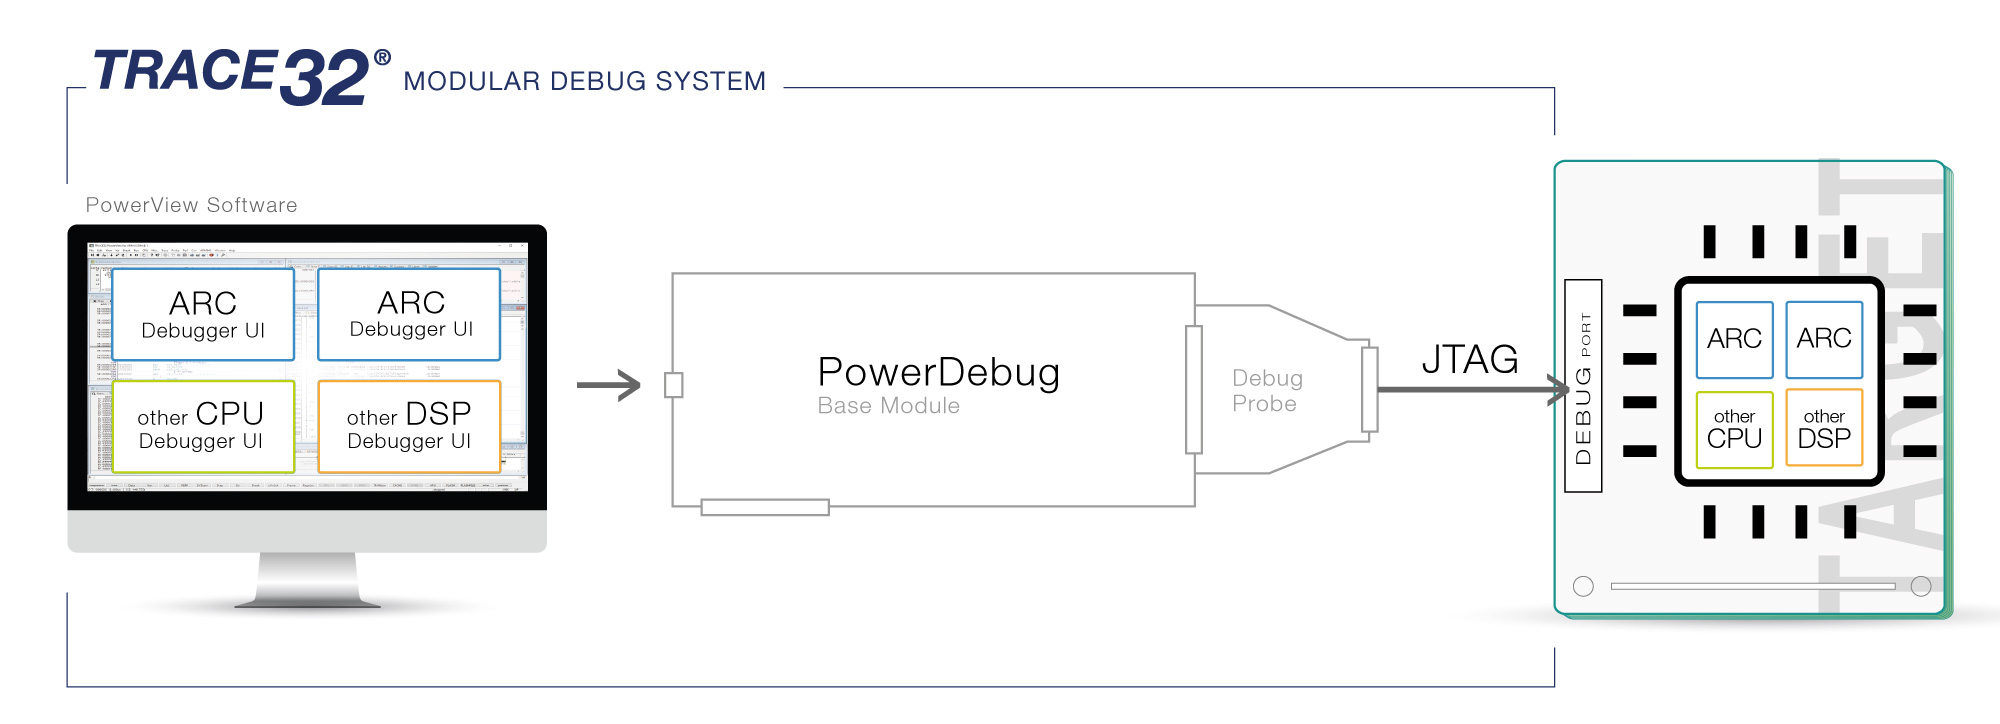
Using our TRACE32® tools you can debug and control any ARC core (along with all of the other cores) in an SoC via a single debug interface, all at the same time. The core configuration is automatically detected including most ARC Designware optional features. For cores implementing the ARC Trace (RTT), TRACE32® tools support real-time on- and off-chip tracing.

Supported Sub-Architectures

ARC-HS, ARC-EM, ARC-EV,ARC-VPX, ARC600/700, ARCtangent-A4/A5

DEBUG HIGHLIGHTS

Utilizing All Debug Features

Explore and utilize all the powerful and well-known features of your ARC core with Lauterbach debug modules: full on-chip breakpoint support; run-time memory access; flash programming; benchmark counters; and cache view. And of course, everything is scriptable, enabling you to repeat the same test-sequence over and over.

Learn more about our debug system 
  • ARC Debug Solutions - TRACE32

Support of any Debug Interface Protocol

Debug via classic JTAG, compact JTAG (2-wire), Arm CoreSight SoC-400/600 (SWD, APB, JTAG-AP) and further modes (e.g. with TriCore).

Simplify Diagnostics and Data Transfer

Print messages from your target application directly to your TRACE32 GUI with a simple "printf" utilizing the Metaware Hostlink Library. Open and save files on your host via your target application.

Debug ARC Cores in Multi-Architecture SoCs

Debug all your ARC cores and non-ARC cores at the same time with the same debug probe.

Debug the full Software Stack

Work with many popular target operating systems like FreeRTOS™, ThreadX, MQX™ and others. TRACE32® OS-aware debugging can query and display all OS objects such as threads, message queues, etc.

TRACE FEATURES

Capture Your Core’s Actions

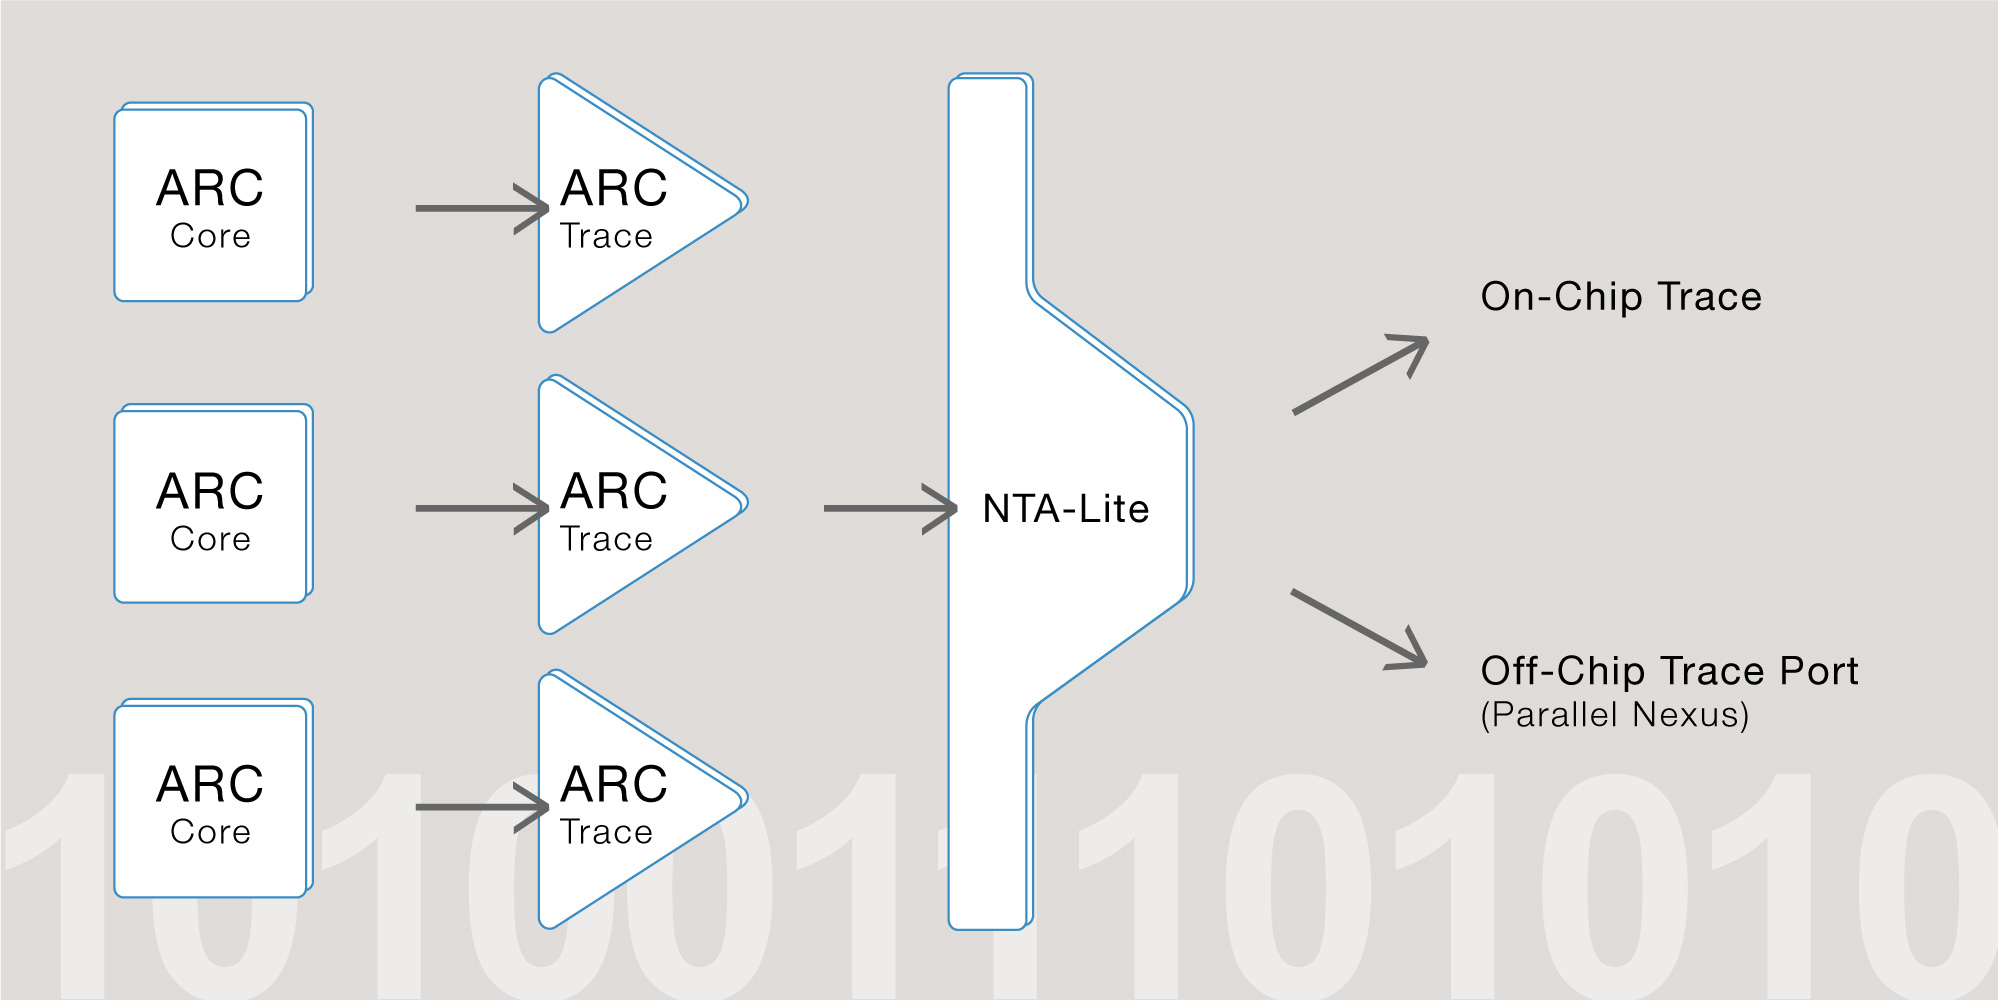
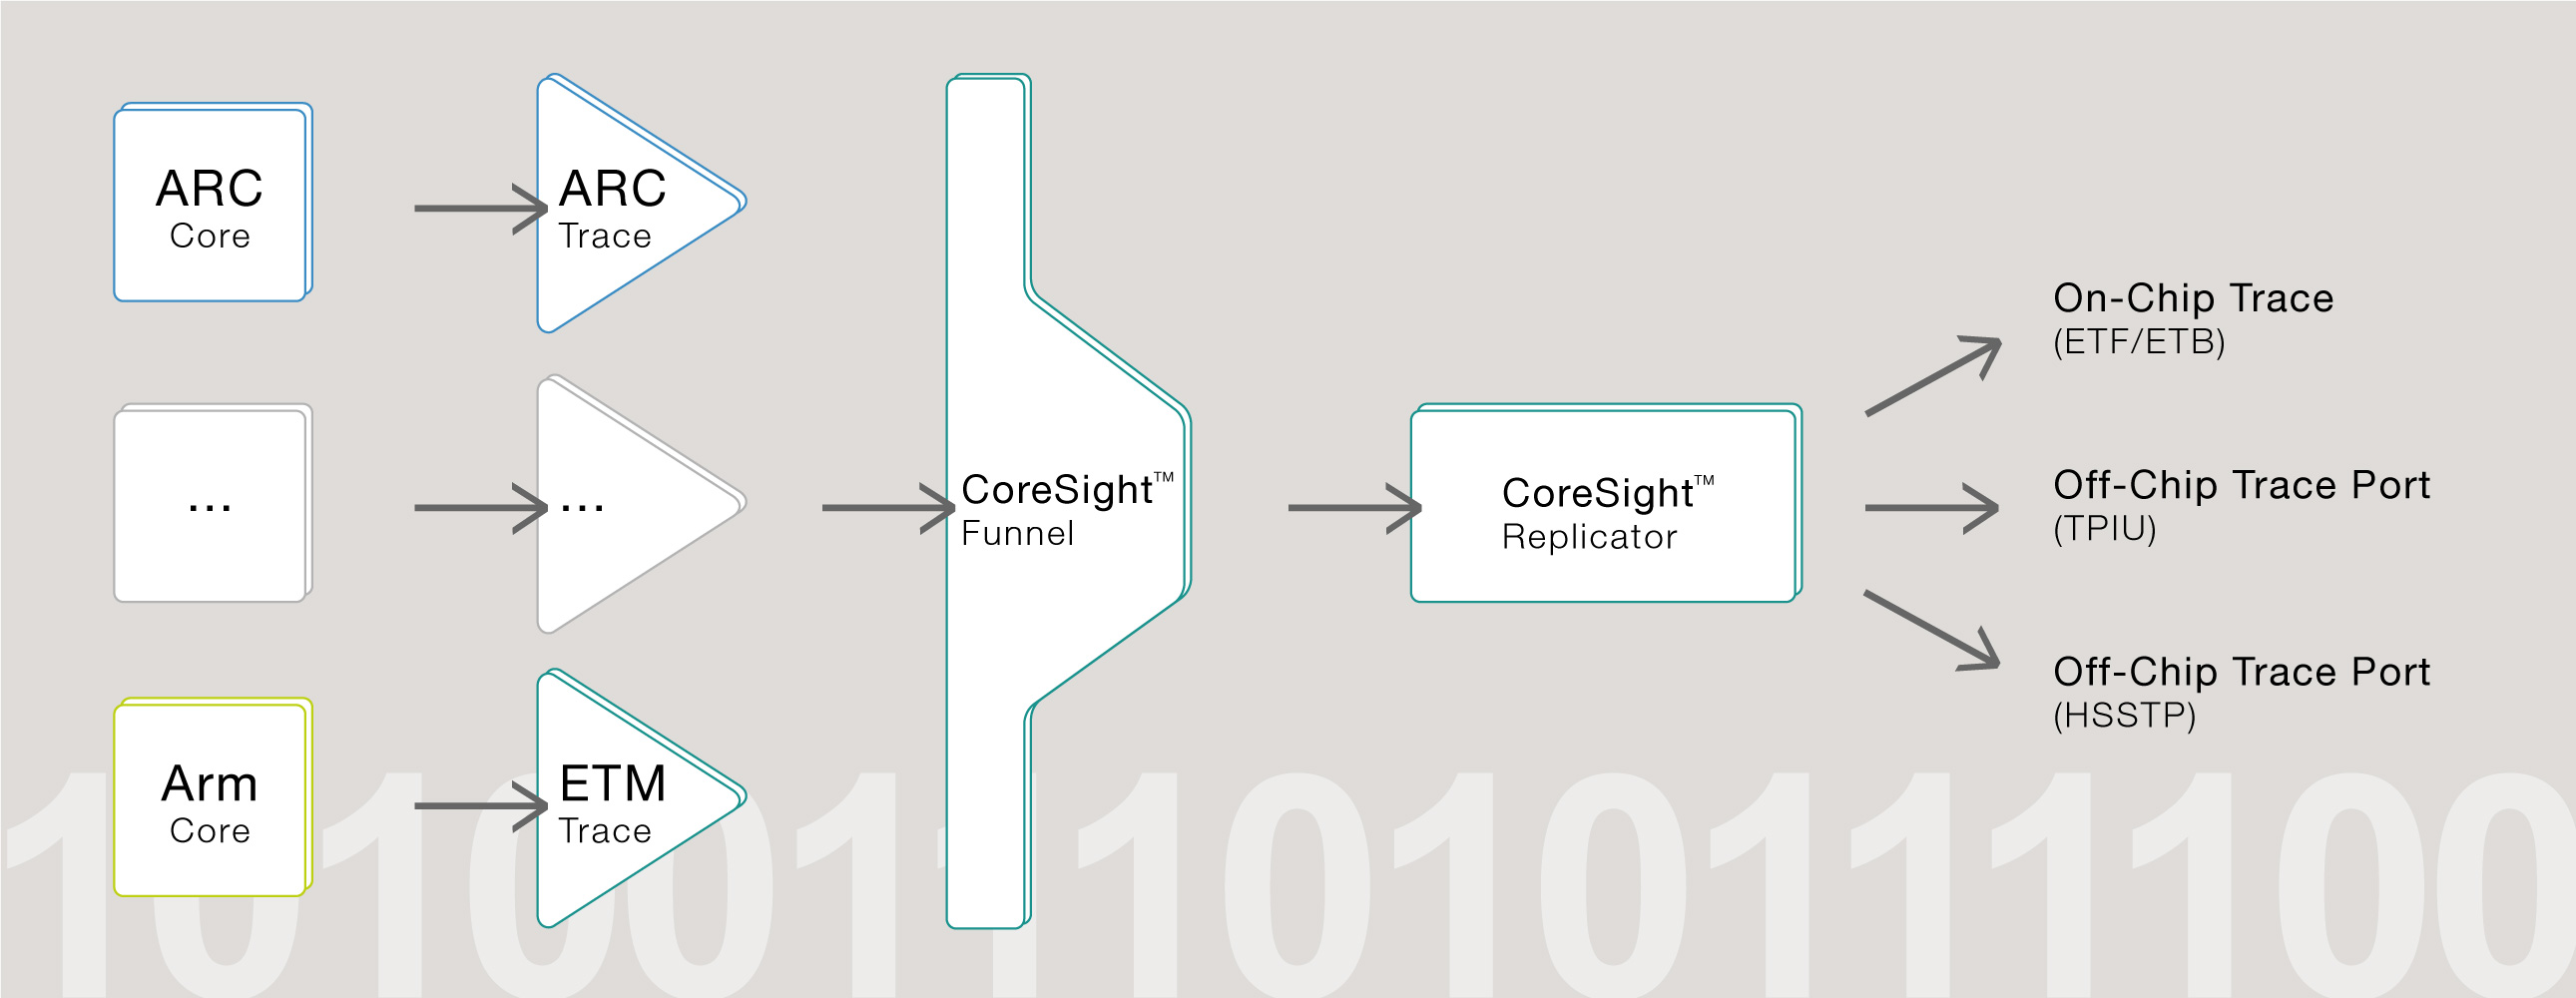
Stop mode debugging can be a powerful tool but tracing is even better. Our trace solutions for ARC support both the SmaRT on-chip trace and the much more powerful DesignWare ARC Trace, which can save the trace-data inside the target memory or emit it to one of our PowerTrace tools. TRACE32® tools also support ARC Trace inside an Arm CoreSight trace infrastructure.

Learn more about our trace system  

  • Tests_ARC
  • Tests_CoreSight

Utilize DesignWare ARC Trace

ARC cores with ARC Trace (RTT) can provide both program and data trace via Nexus messages. Our trace solutions allow you to reduce the trace to certain functions and/or variables, to focus on certain aspects or to increase the run-time of the recording.

Support of Small Register Trace

The small on-chip register trace (SmaRT) is not as powerful as the full ARC Trace. It allows to identify specific errors appearing only during run-time like the source of an exception.

Analyze Interactions between Multiples Cores

Our trace solution supports multicore tracing to record and analyze the dynamic interaction between cores. For mixed-architectures SoCs, we support protocols like CoreSight, to concurrently trace ARC and non-ARC cores.

Obtain Detailed Runtime Information

Our trace solutions can record the complete program flow, provided by the SoCs ARC Trace (RTT) IP. Based on the data recorded, our tools provide you with detailed timing and code-coverage measurements. This works best with the deep memory of our PowerTrace modules.

VIRTUAL PROTOTYPING

Get Ready Before Your Silicon is

Test your ARC code in your custom SoC before your SoC is ready. Taping out your SoC takes a lot of time but TRACE32 allows you to start software development on virtual prototypes and simulators, using the same GUI and toolset that you would use later with the real chip. To some extent it is also possible to verify the debug interface of your individual SoC before starting the taping out.

Debug code running in Synopsys nSIM

For early development requiring an accurate processor model, connect TRACE32® PowerView directly to the Synopsys ARC nSIM instruction set simulator via the ARCINT API.

Debug Code in SystemC Models

Connect Trace32® PowerView with Synopsys Virtualizer via the multi-core debug (MCD) API for debugging code in full-processor models.

Unit Testing with Integrated Instruction Set Simulator

TRACE32® PowerView provides a built-in instruction set simulator, which is perfect for module and regression tests. Via a dedicated API, you can extend the simulator with your own peripheral models of your hardware.

Perform Pre-Silicon Verification

Verify your SoC, including debug mechanisms, before taping out, using simulated Verilog or VHDL netlists. The Lauterbach Generic Transactor Library (GTL) allows you to perform pre-silicon debugging on JTAG level.

TOOLCHAIN SUPPORT

3rd Party Tools Supported for ARC

Target OS (6)
Product
Company
FreeRTOS
Linux
uCOS-II
Compiler (2)
Product
Company
Language
GNU-GCC
C, C++
METAWARE-C/C++
C, C++

The following features are available for all architectures supported by TRACE32. Please contact us if your device or tool is not listed here; support is often already on its way.

Host OS

Our debug software runs on all major operating systems.

Flash Devices

We support the programming of a large variety of flash devices. NOR, NAND, SPI, QSPI, EMMC and more.

3rd Party Integrations

Integrations allow you to easily use TRACE32 with other tools.