Lauterbach GTL API
Partner for Electronic Design Automation Tools
The Generic Transactor Library (GTL) is an API that provides an interface between Lauterbach's TRACE32 debugger and target system by proprietary debug protocols, e.g., JTAG. It enables the debugger to communicate with external RTL emulation or simulation models and exchange data with them, allowing users to test and verify their designs on an emulated or simulated target platform. Furthermore, it allows building custom, integrated debug and trace systems.
The Number One Tool to Debug Emulated SoCs
Debugging on SoCs has never been so easy. Benefit from having the same user experience, regardless of if an emulation system or real target hardware is under test. Benefit from working with a system with a consistent behavior in any scenario. Our sophisticated GTL API will bring you closer to the emulation system, and closer to your time schedule.
Get easy access to emulation systems
The GTL API provides a standardized software interface between the TRACE32 debugger and external simulation environments. This helps improve interoperability between TRACE32 PowerView and emulation systems, making it easy to debug and test the emulated SoC. Software based access enables you to access and manage the emulator from all over the world by test and development teams.
Rely on a realistic test environment
The GTL API supports many interface layers to access physical layer transactors, bus level transactors or trace recording transactors. Using the physical layer transactors empowers you to perform realistic tests, as close to a physical debug/DUT setup as possible. You can, e.g., verify the functionality of the JTAG TAP controller of your SoC before tape-out. Using high-level transactors can accelerate test procedures when physical layer verification is not required.
Run TRACE32 in parallel with other transactors
Because of the use of transactors instead of physical breakout boards, the adaptation to a non-continuous emulation clock is possible out of the box. This enables you to work with TRACE32, even if other transactors temporarily halt the emulation clock.
Obtain full debug and trace functionality
GTL provides advanced debugging capabilities, including the ability to capture and analyze real-time data from the target system and the simulation environment. This helps you to identify and debug issues early in the development process, reducing time-to-market and improving overall product quality.
Reuse your work results
The TRACE32 PowerView GUI offers you the same features throughout the whole development cycle. Reusing work results, test scripts, and the ability to test between emulation and real hardware will accelerate the development process. Using GTL ensures that the behavior of the debugger is the same in both cases.
Create custom, integrated debug and trace solutions
The GTL API allows building custom, integrated debug and trace systems. This can be done by either using a dedicated core running Linux in the target system that executes a part of the Lauterbach Debug Driver software stack or by implementing a GTL plug-in on the host side.
Debugging and tracing via the GTL API
The GTL is a proprietary, confidential API invented by Lauterbach to allow EDA partners or customers to build custom debug and trace solutions for RTL emulations or other embedded systems.
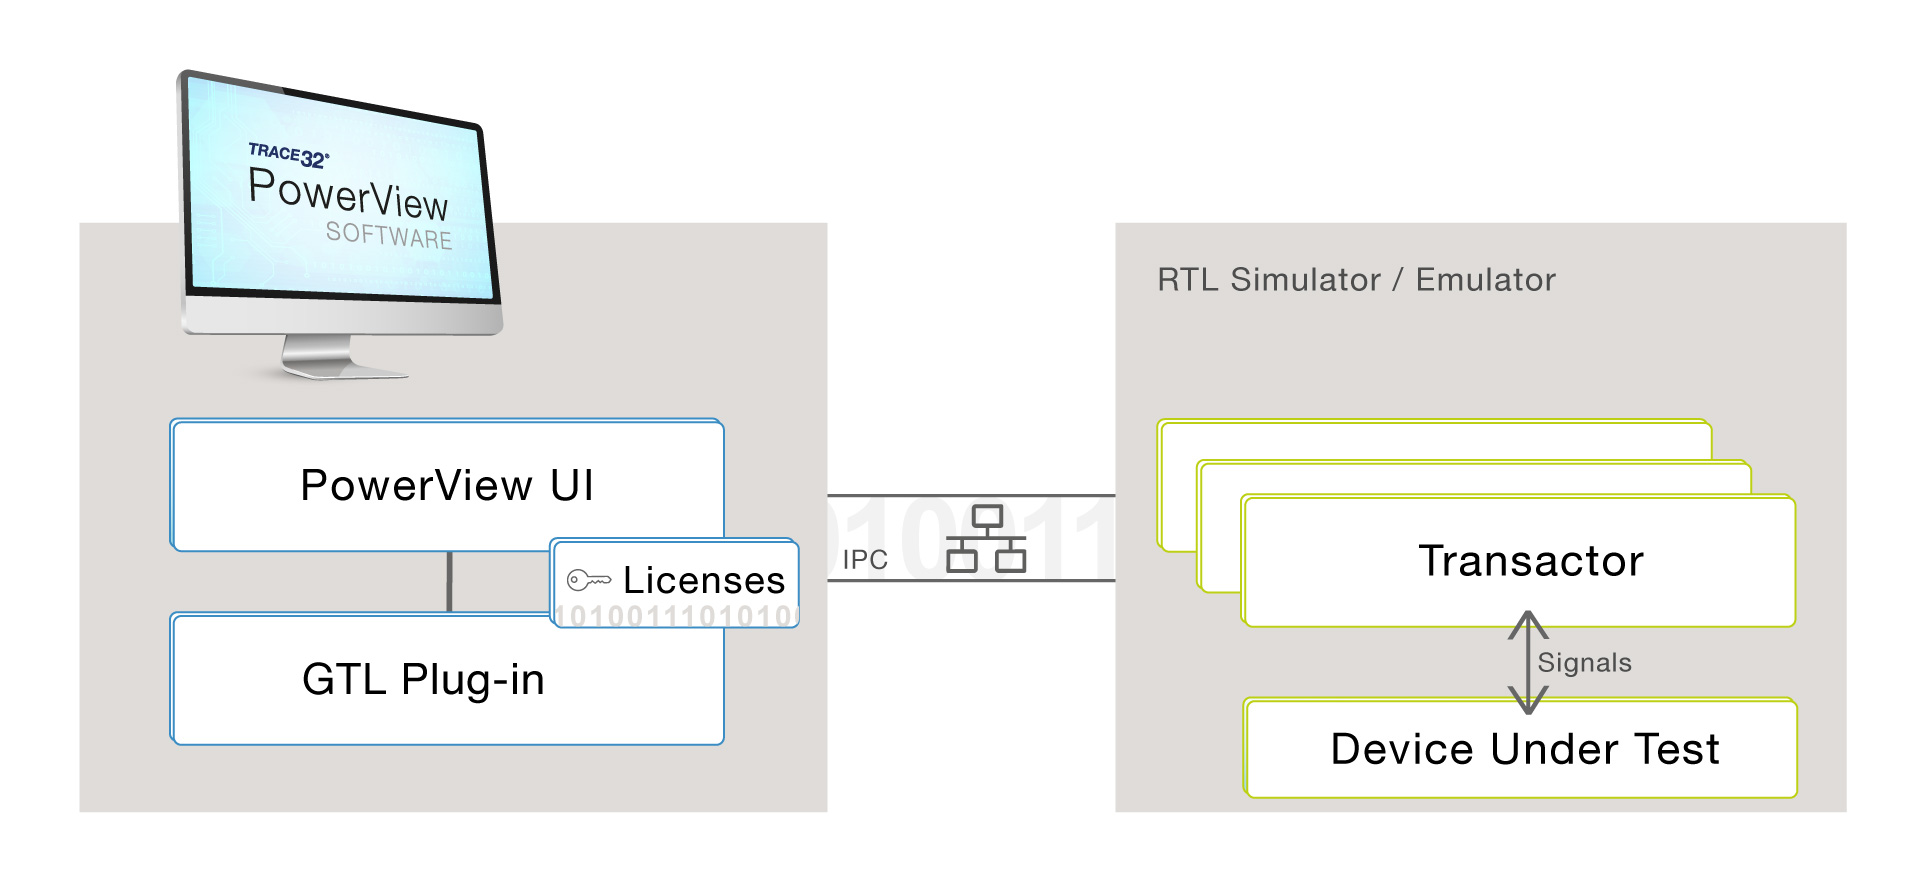
When using GTL, debug commands entered through our PowerView frontend are translated into API calls to the loaded GTL plug-in that is provided by an EDA partner. For RTL emulators, the plug-in uses Inter Process Communication mechanisms to transfer transactions to the Test Bench of the emulator, where the transactors are located. The transactors interact with the Device Under Test. Immediately after a transaction has been executed by the transactor, the result is returned to PowerView.


