PowerDebug X51
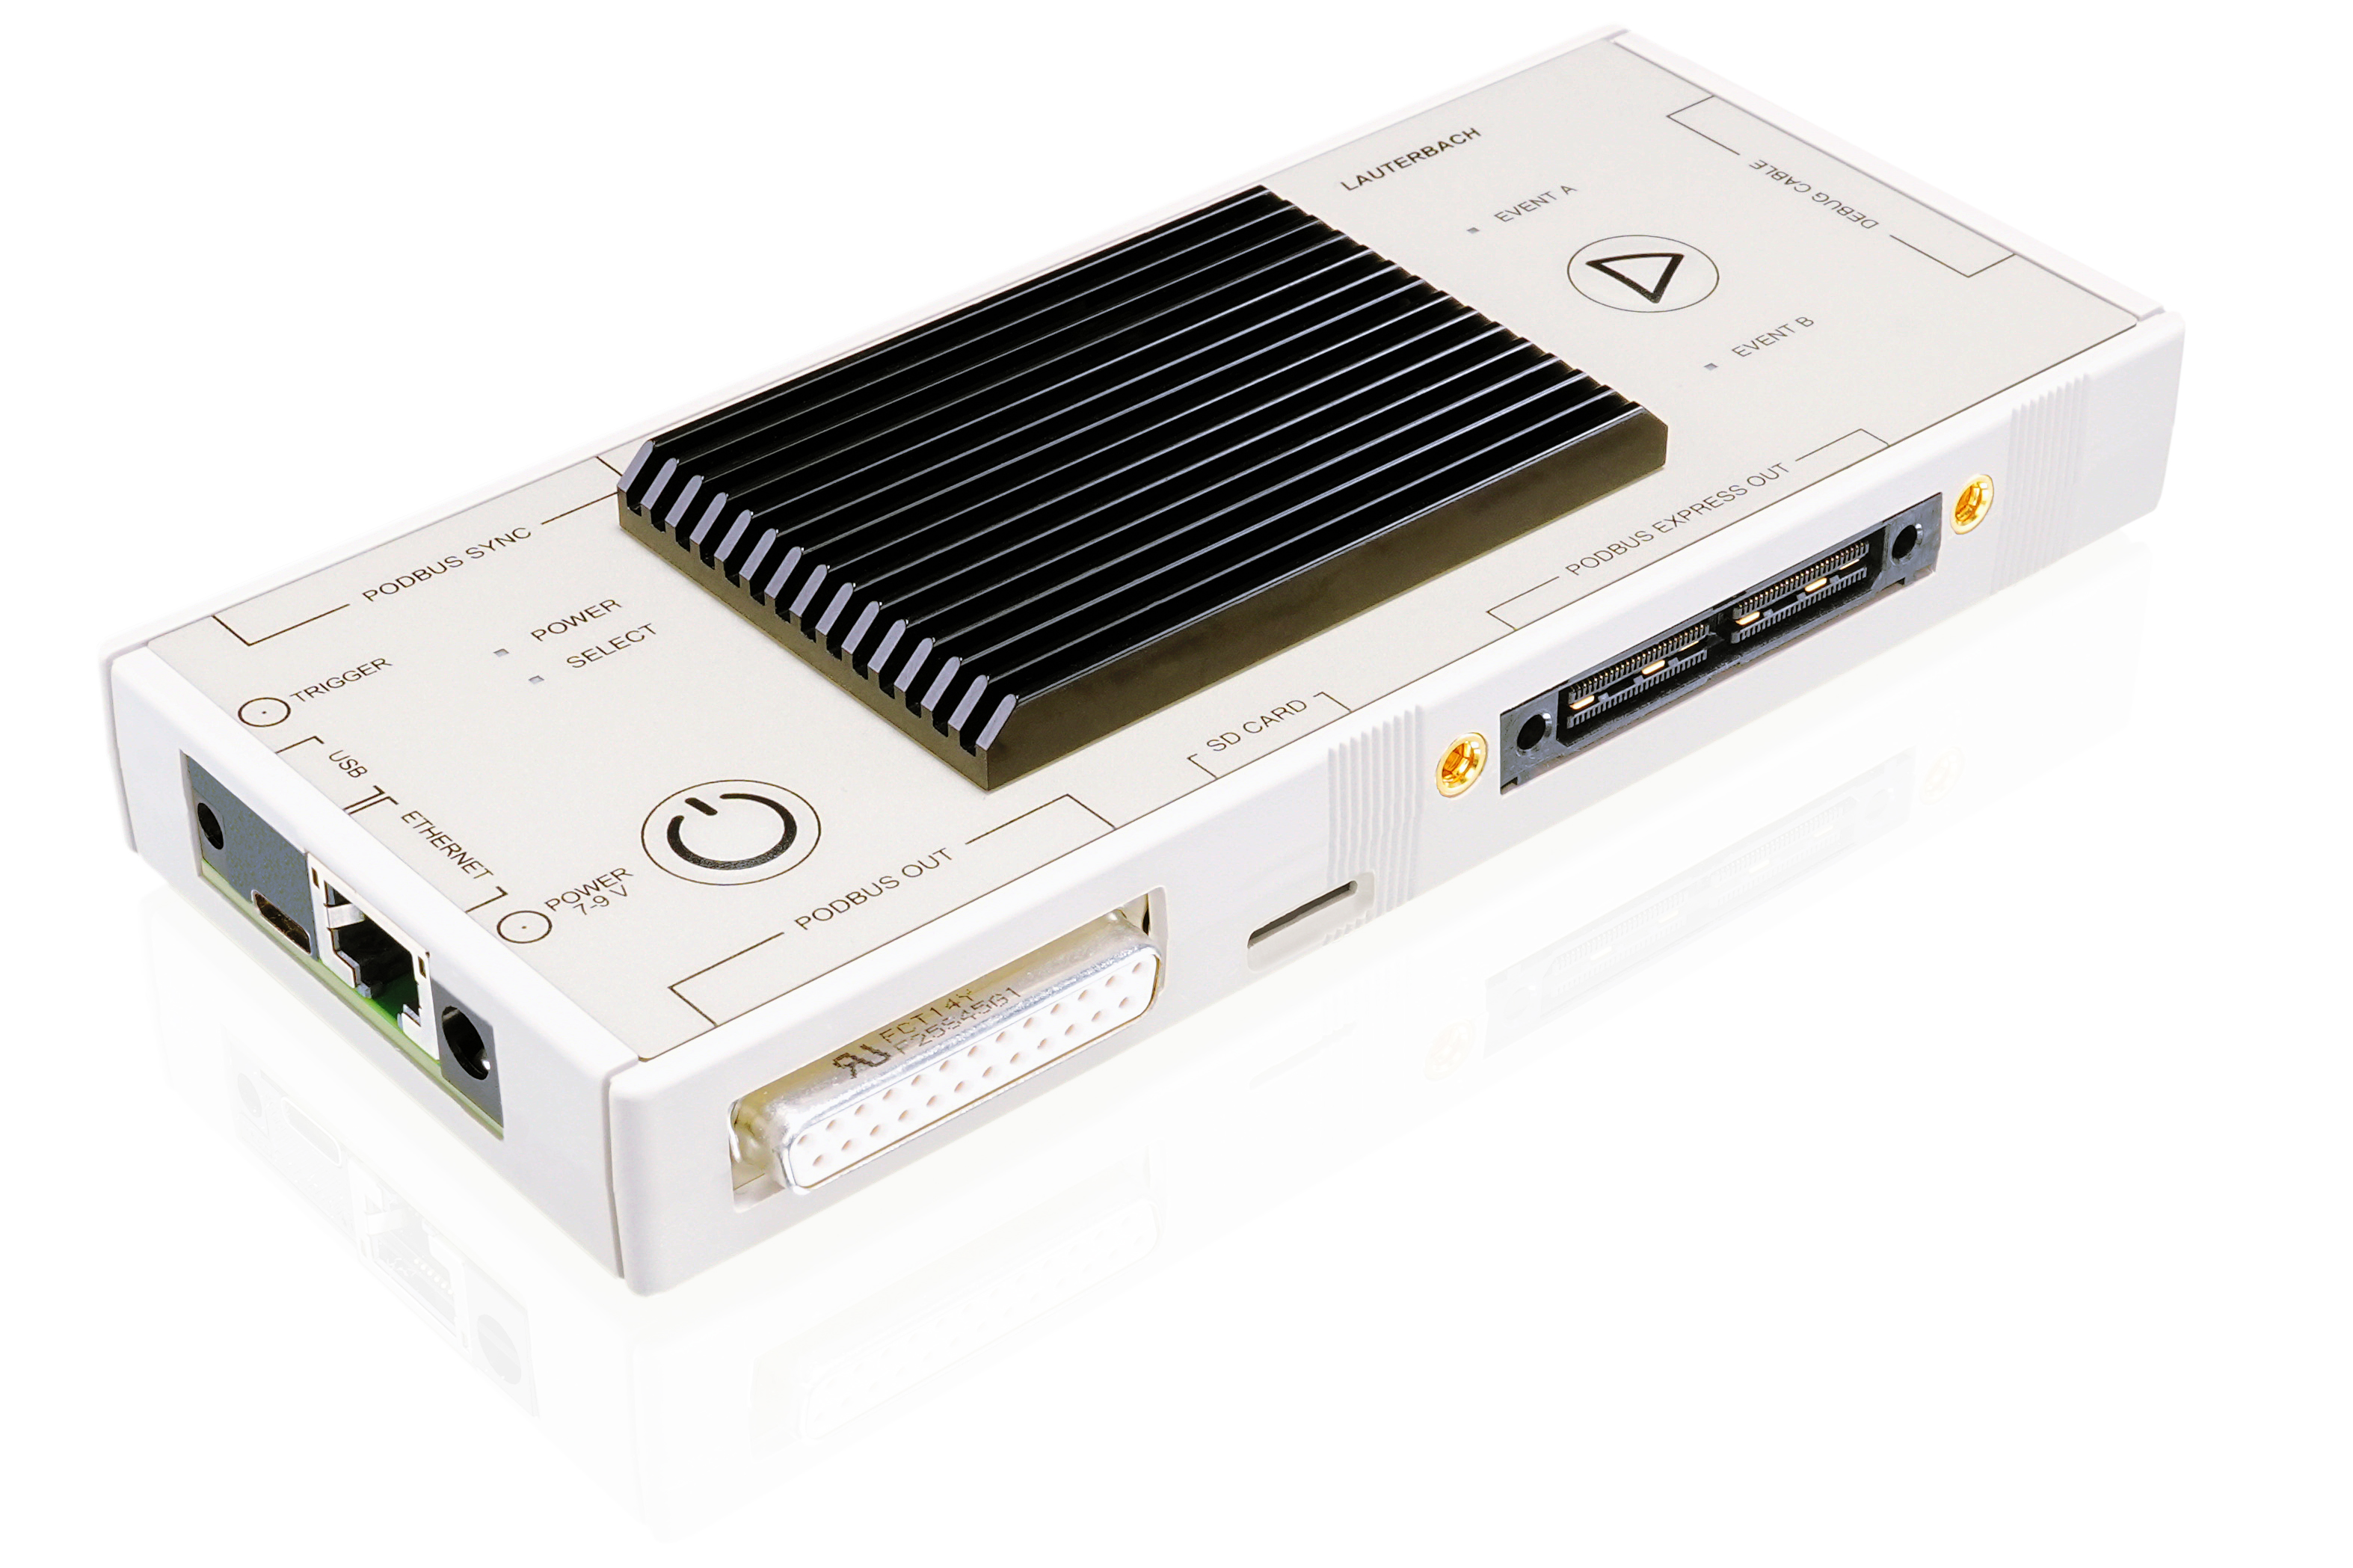

Expandable, High-performance Debugger
PowerDebug X51 is our high-performance, modular, and future-proof debug controller. It can be expanded with PowerTrace, our leading embedded off-chip trace solution, as well as our logic-analyzers. You can connect it to your PC via USB 3 or 2.5 Gigabit Ethernet, making it the perfect solution for both on-site and remote debugging, whereby you can even supply it with power via USB-C without a power supply unit.
No matter what your application looks like today or in the future, the PowerDebug X51 meets all your challenges, maximizes your productivity, and ensures a valuable return on investment.
Perfectly Suited for Any Target
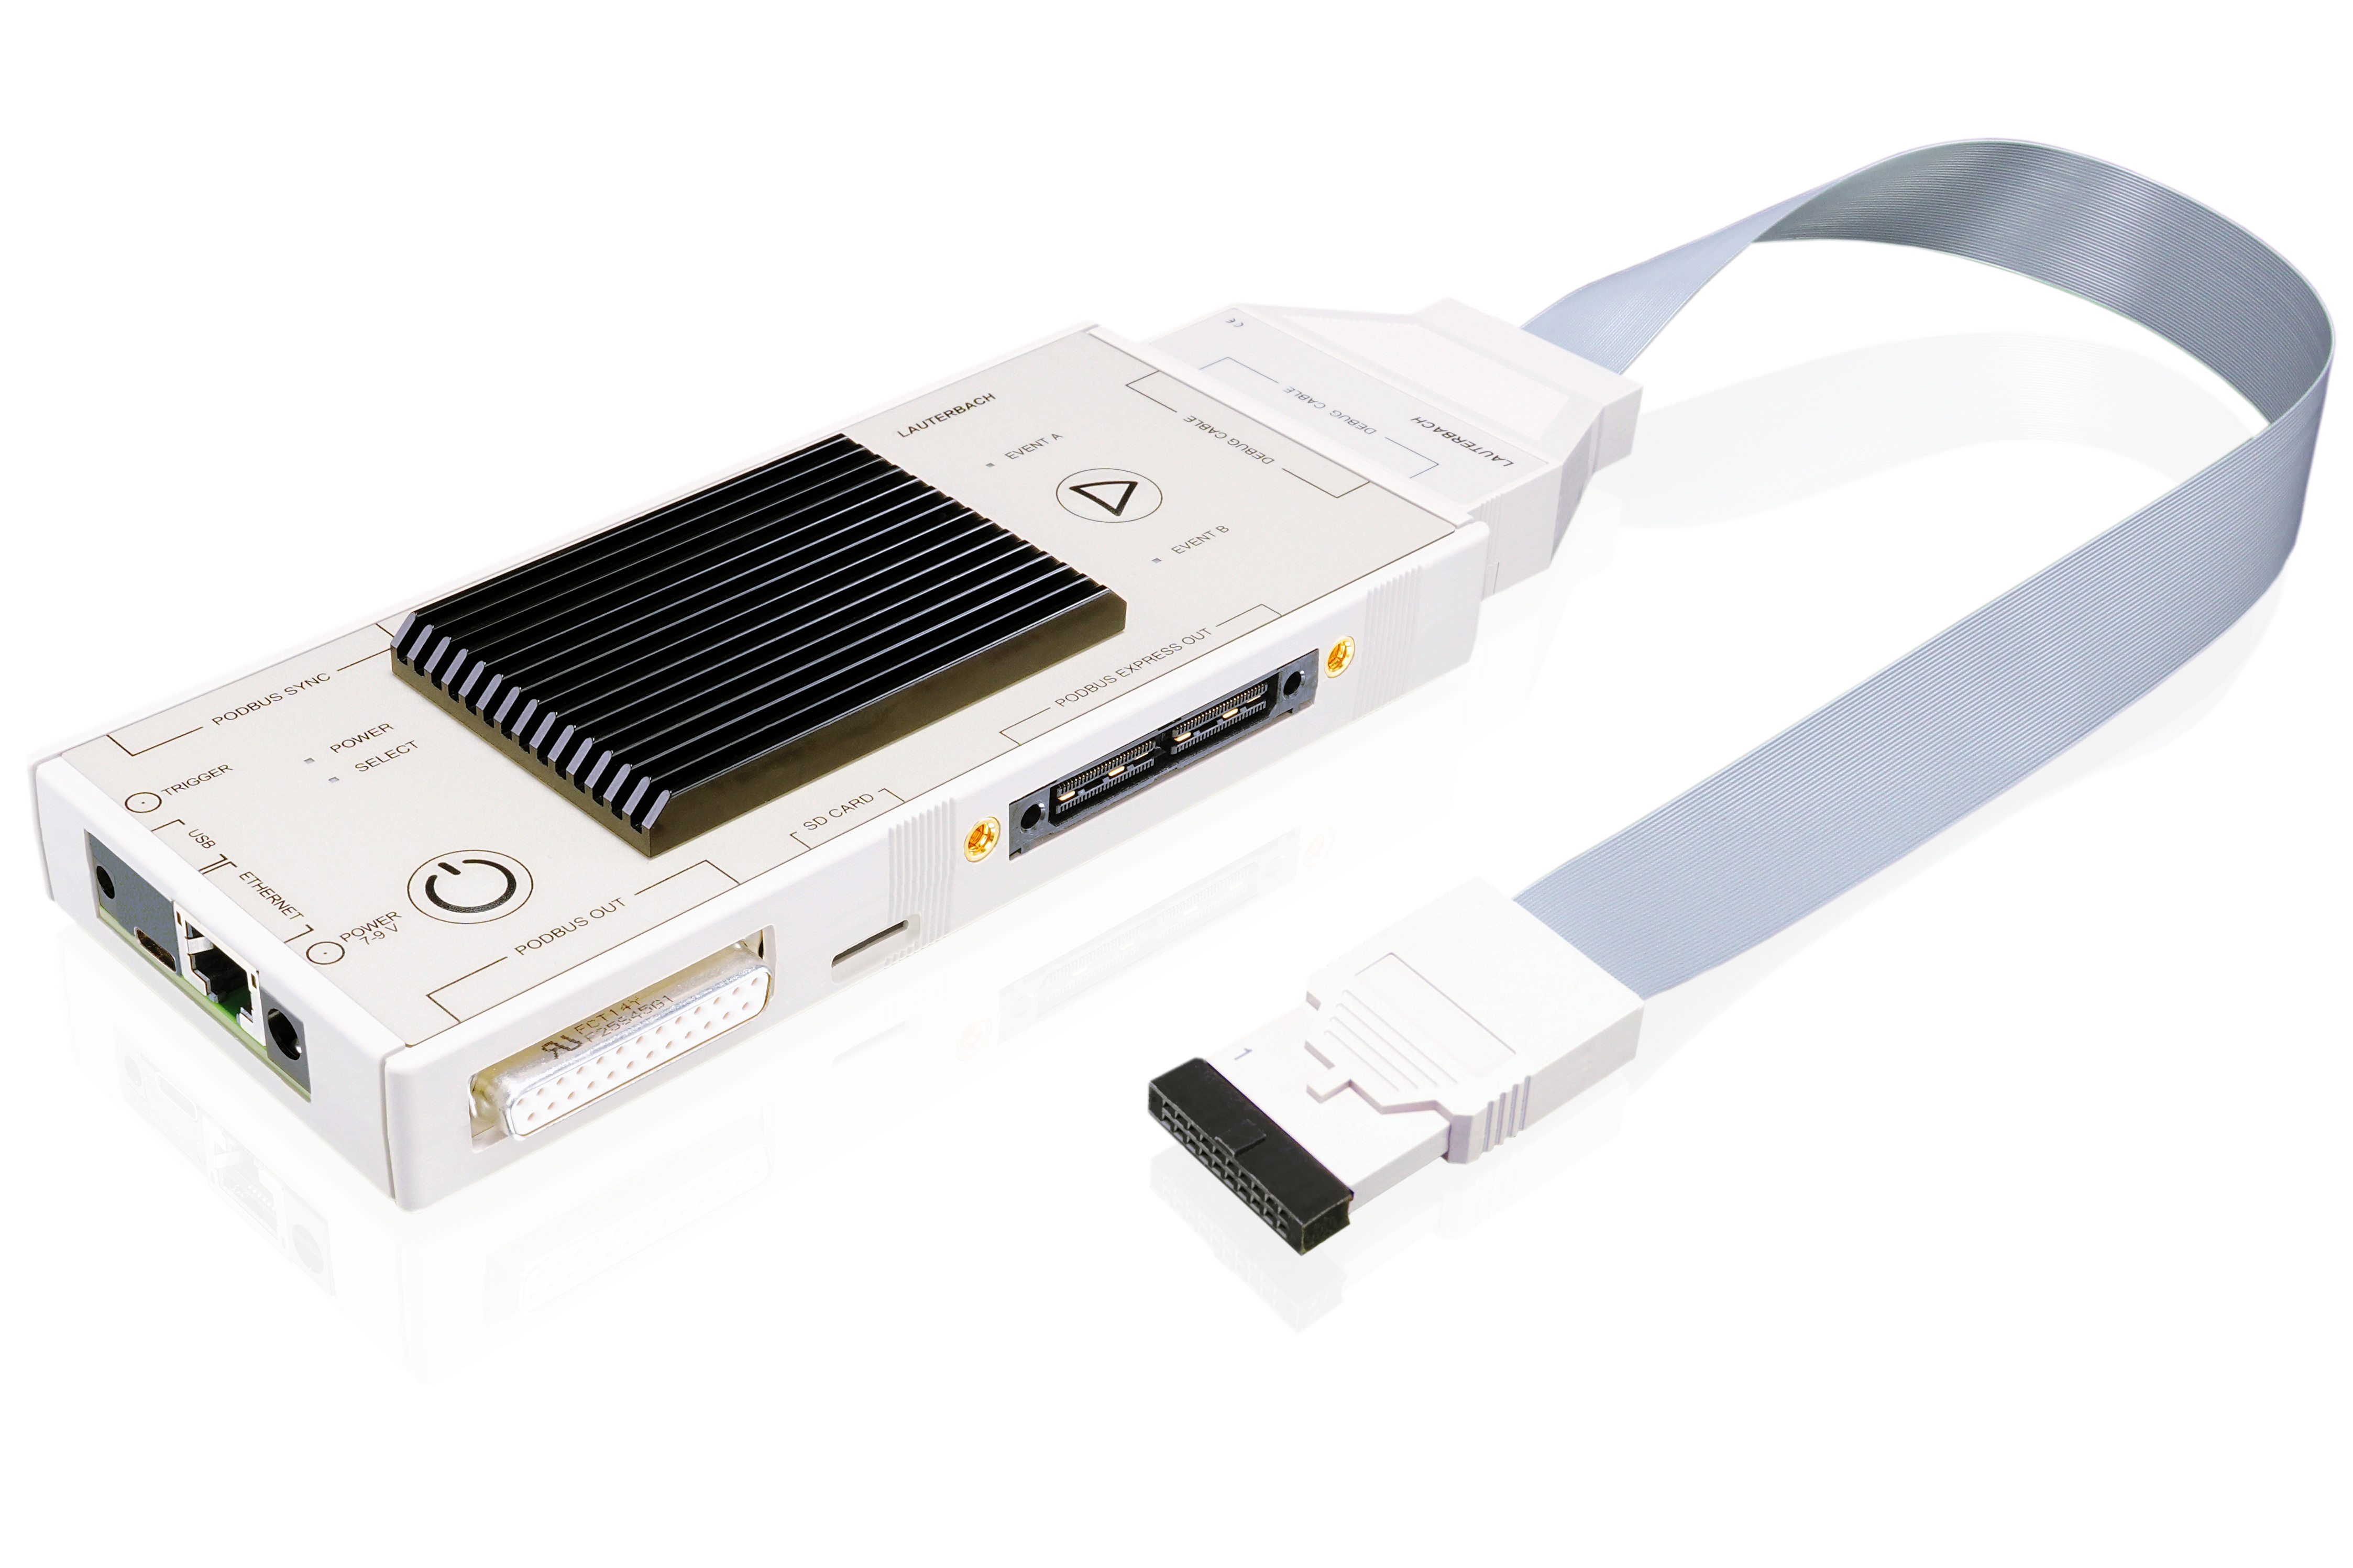
You can connect the PowerDebug X51 to your target via a dedicated debug probe. The probe forms the target-specific part of a TRACE32 debug system and includes the license. By simply exchanging the debug probe, you can switch between different targets without the need to exchange the PowerDebug X51 unit itself.
If cores share an electrically compatible debug interface e.g., several heterogeneous cores in a complex SoC, you can license one debug probe for several core types so that all cores can be debugged simultaneously with a single PowerDebug X51 .


Architecture-specific Probes
Specialized debug probes dedicated to specific target platforms.
See detailsTypical TRACE32 Configurations
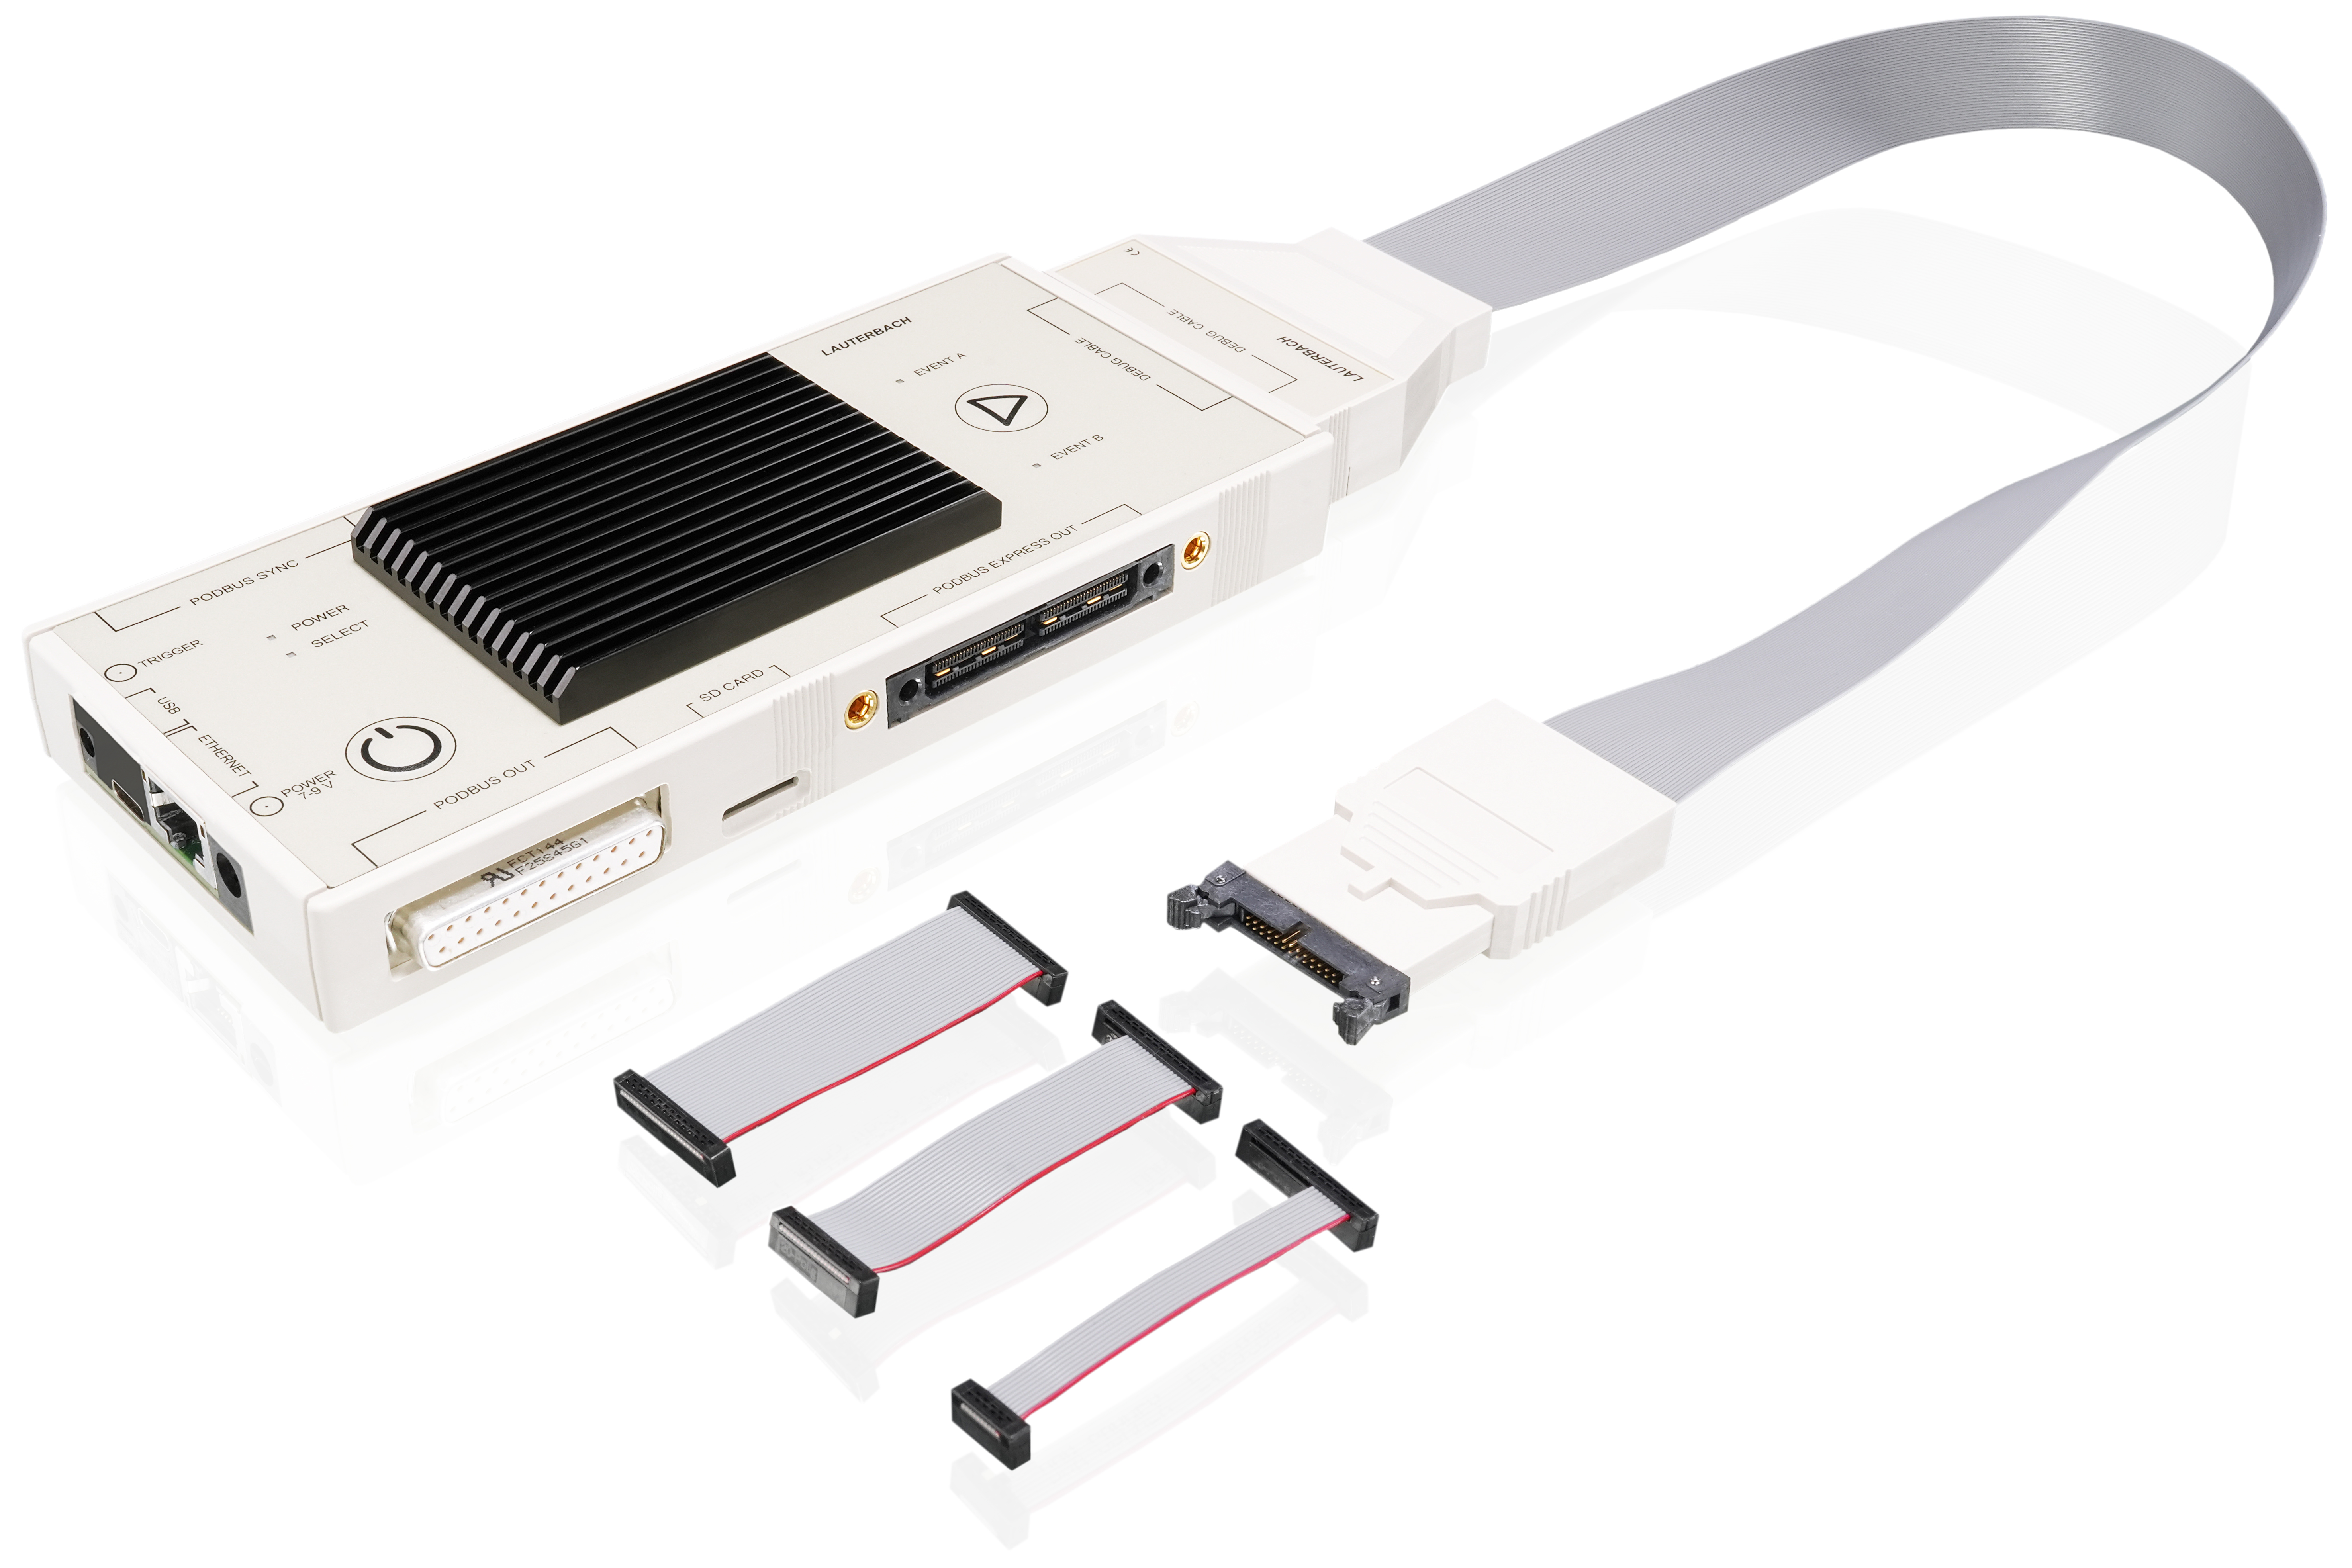
Basic Debug Configuration
For targets with a single JTAG connector, a debug system like this is used. The target device itself may have multiple cores, such as an SoC, or may have a JTAG chain with multiple devices on the board.
Products shown:
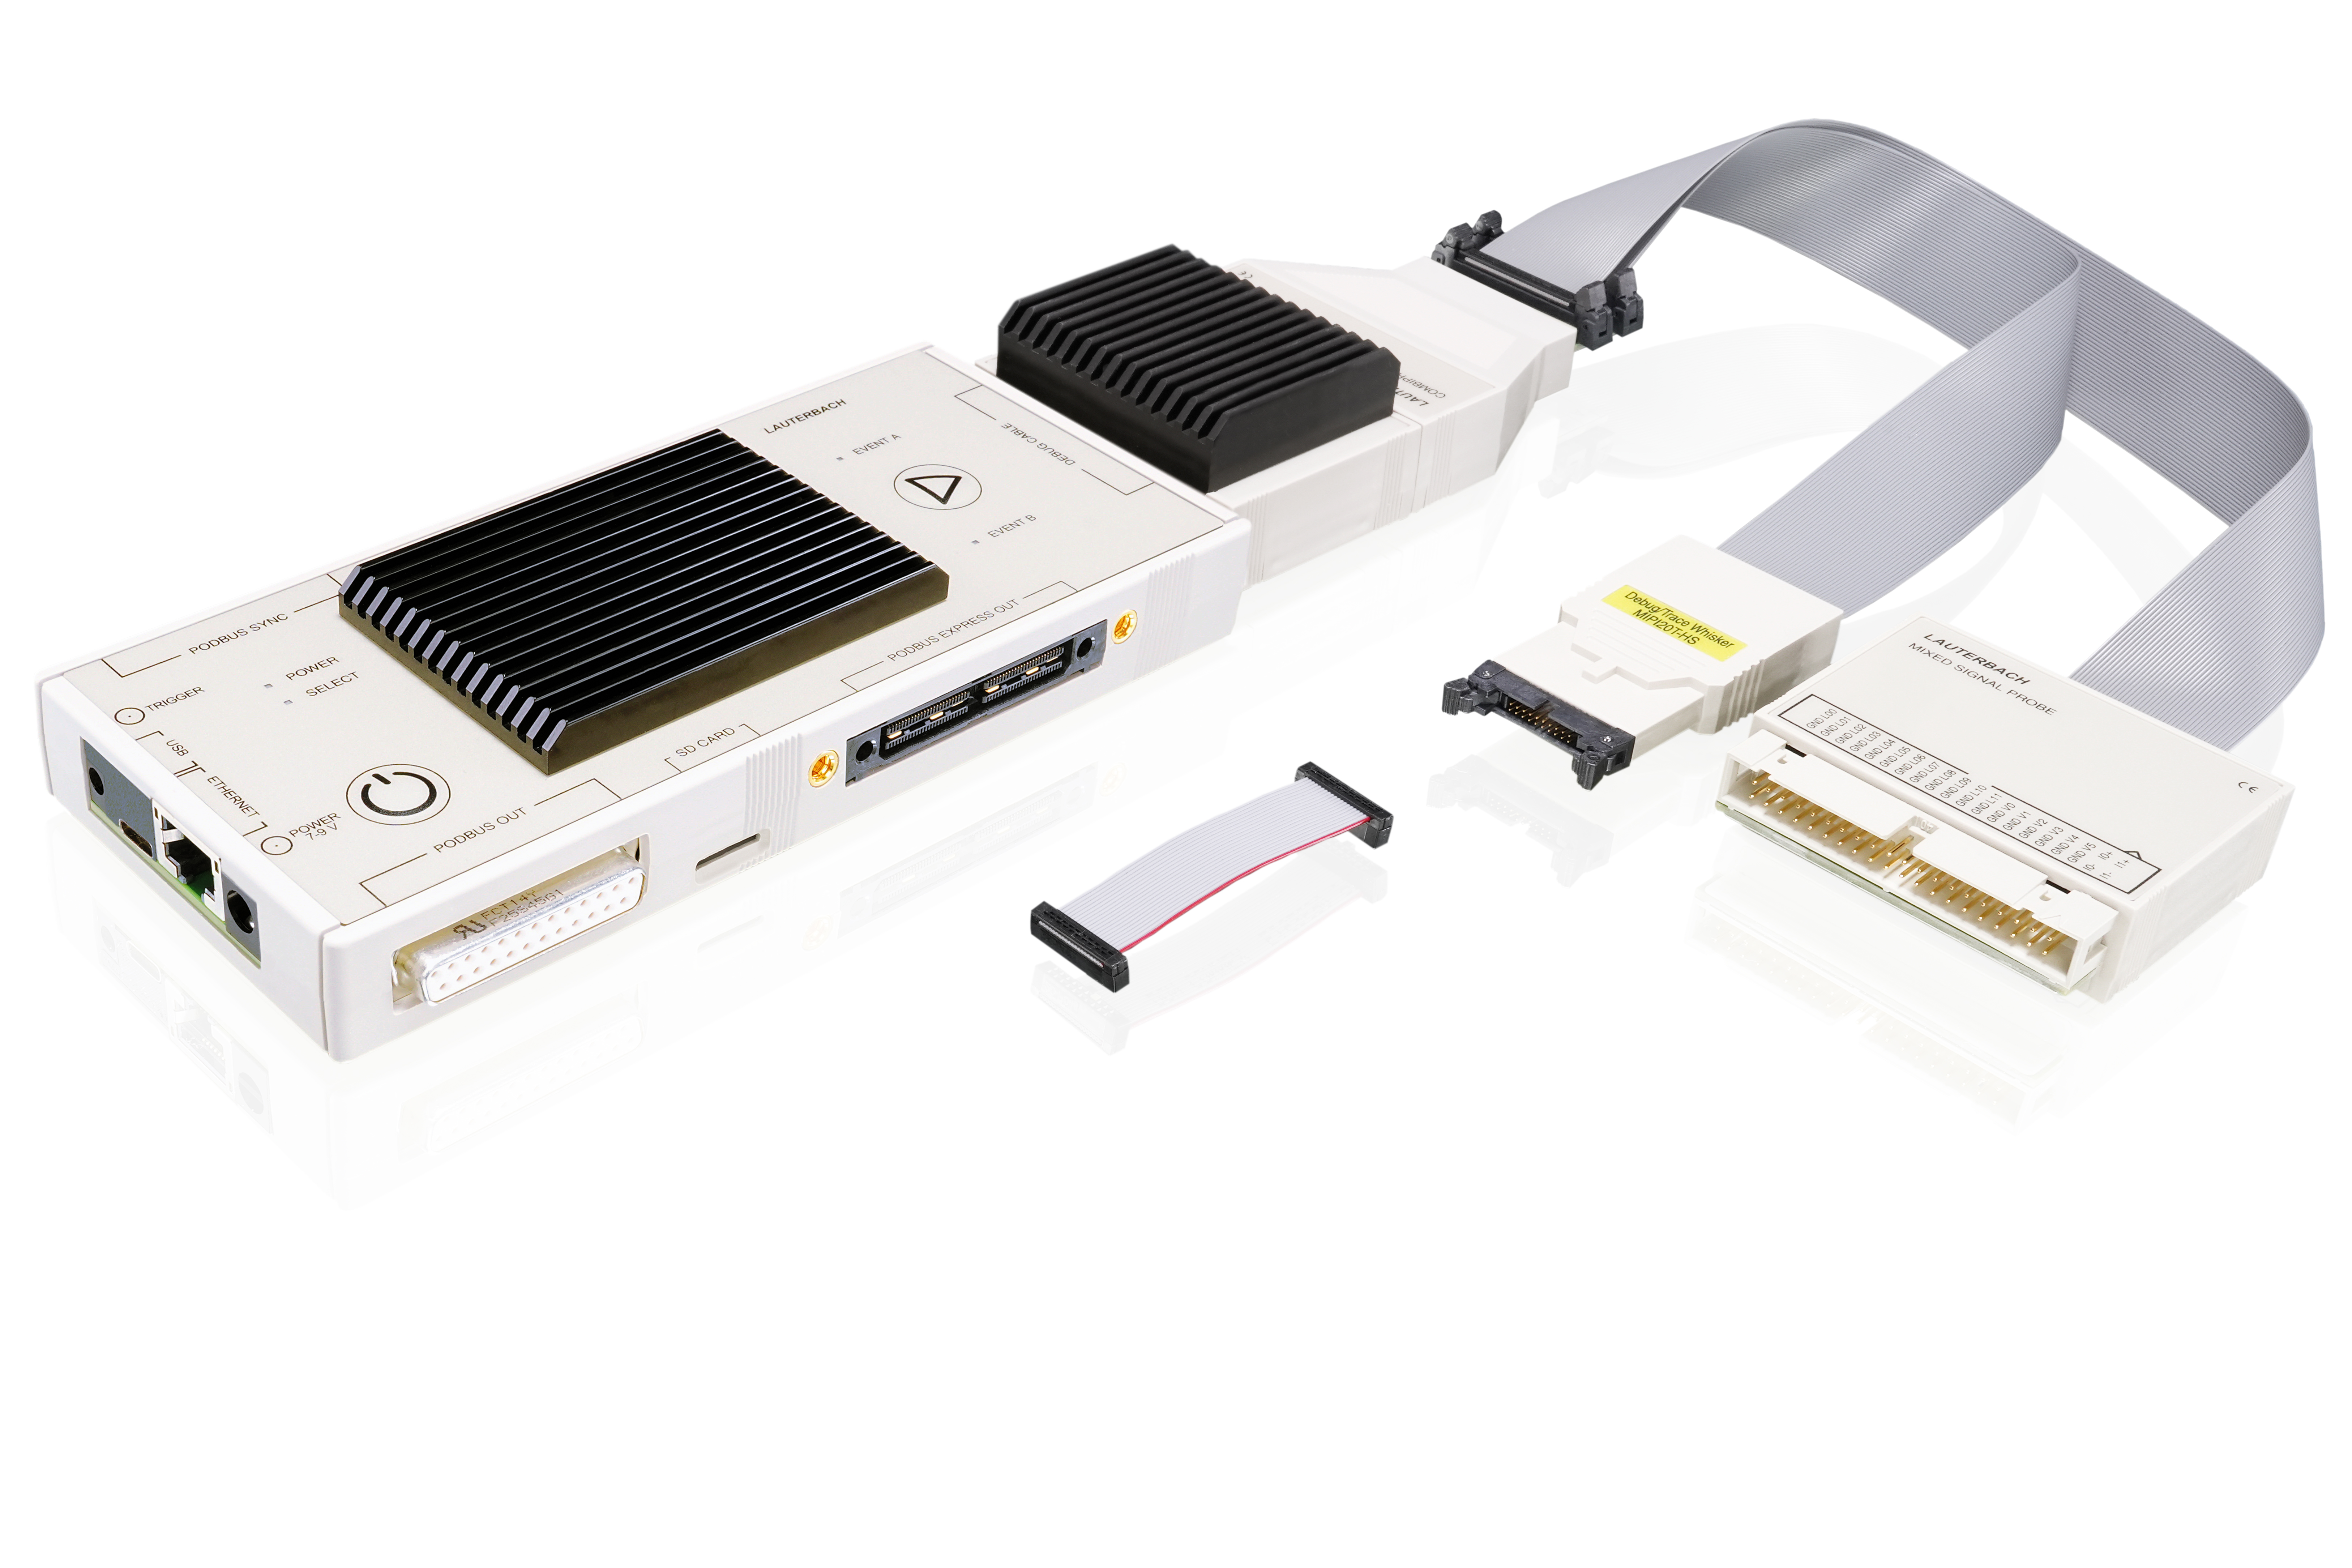
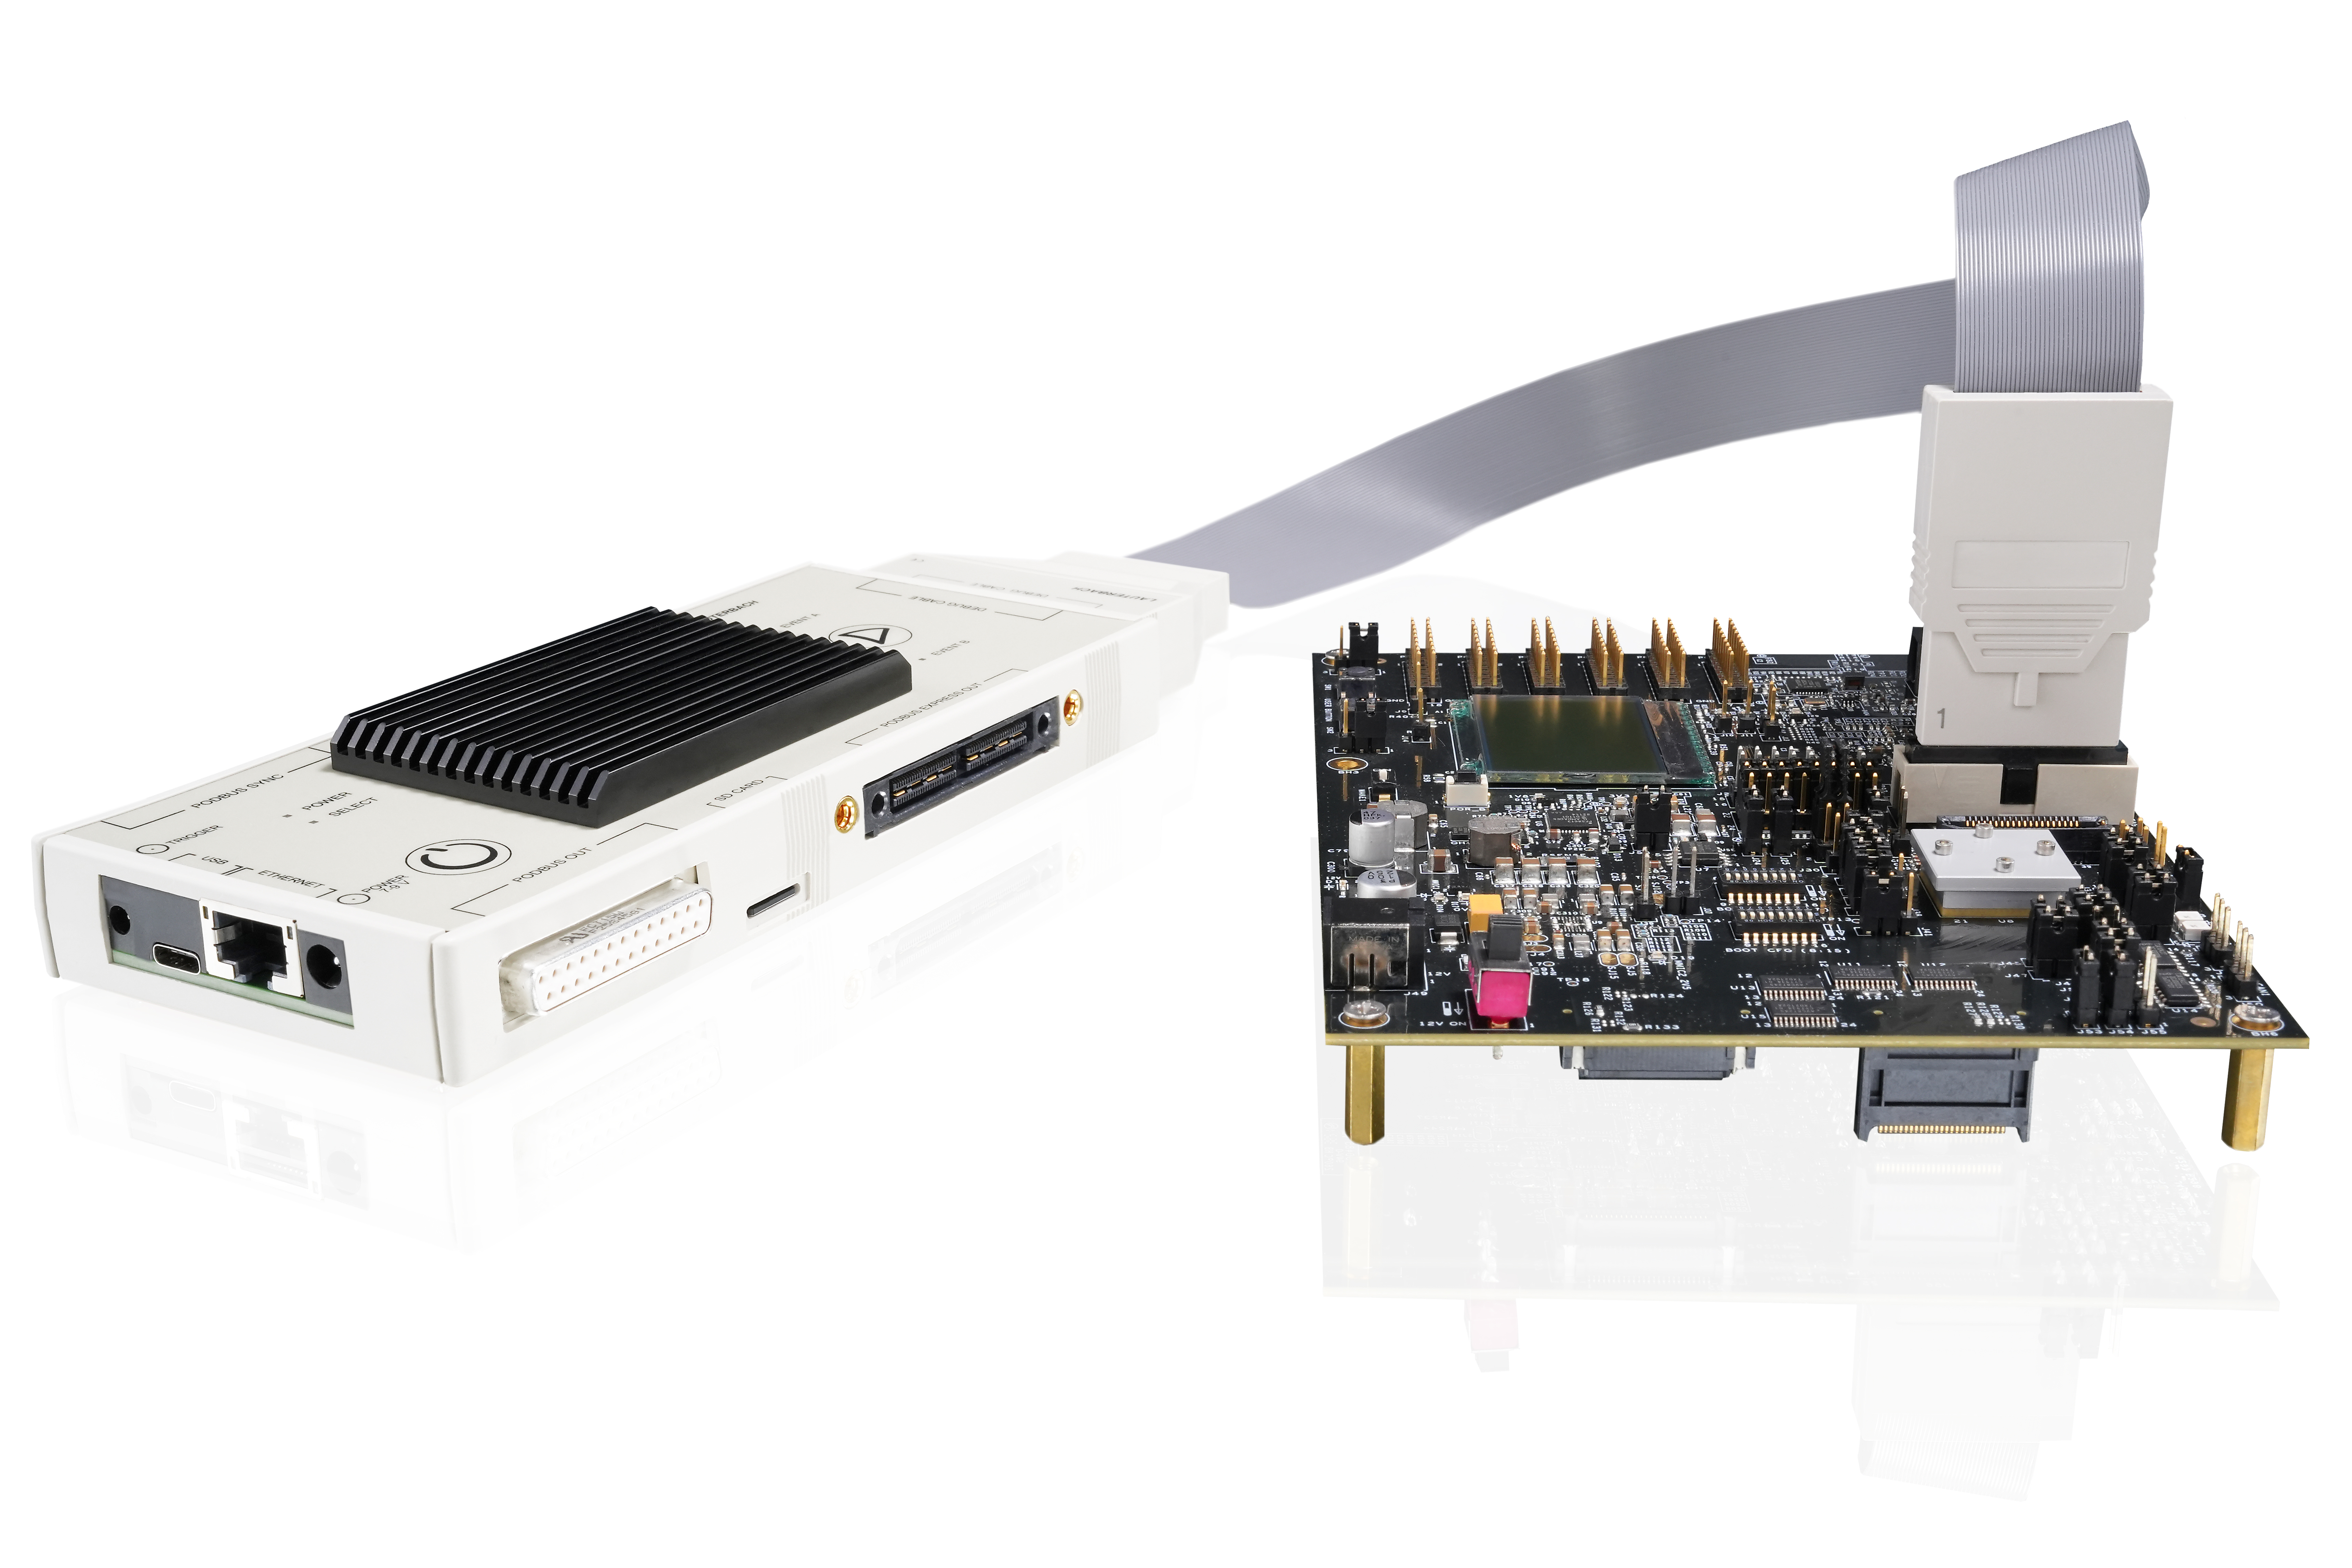
Debug & System Trace Configuration
It combines debug and trace, supporting the 4-bit ETM of a Cortex-M, the Compact Flow Trace (CFT) of TriCore SoCs, system traces like STP, STM, ITM, and others. The two multi-purpose connectors allow the addition of a Mixed Signal Probe for analyzing digital or analog signals. Alternatively, you can connect a second whisker for debugging and tracing dual-chip configurations.
Products shown:
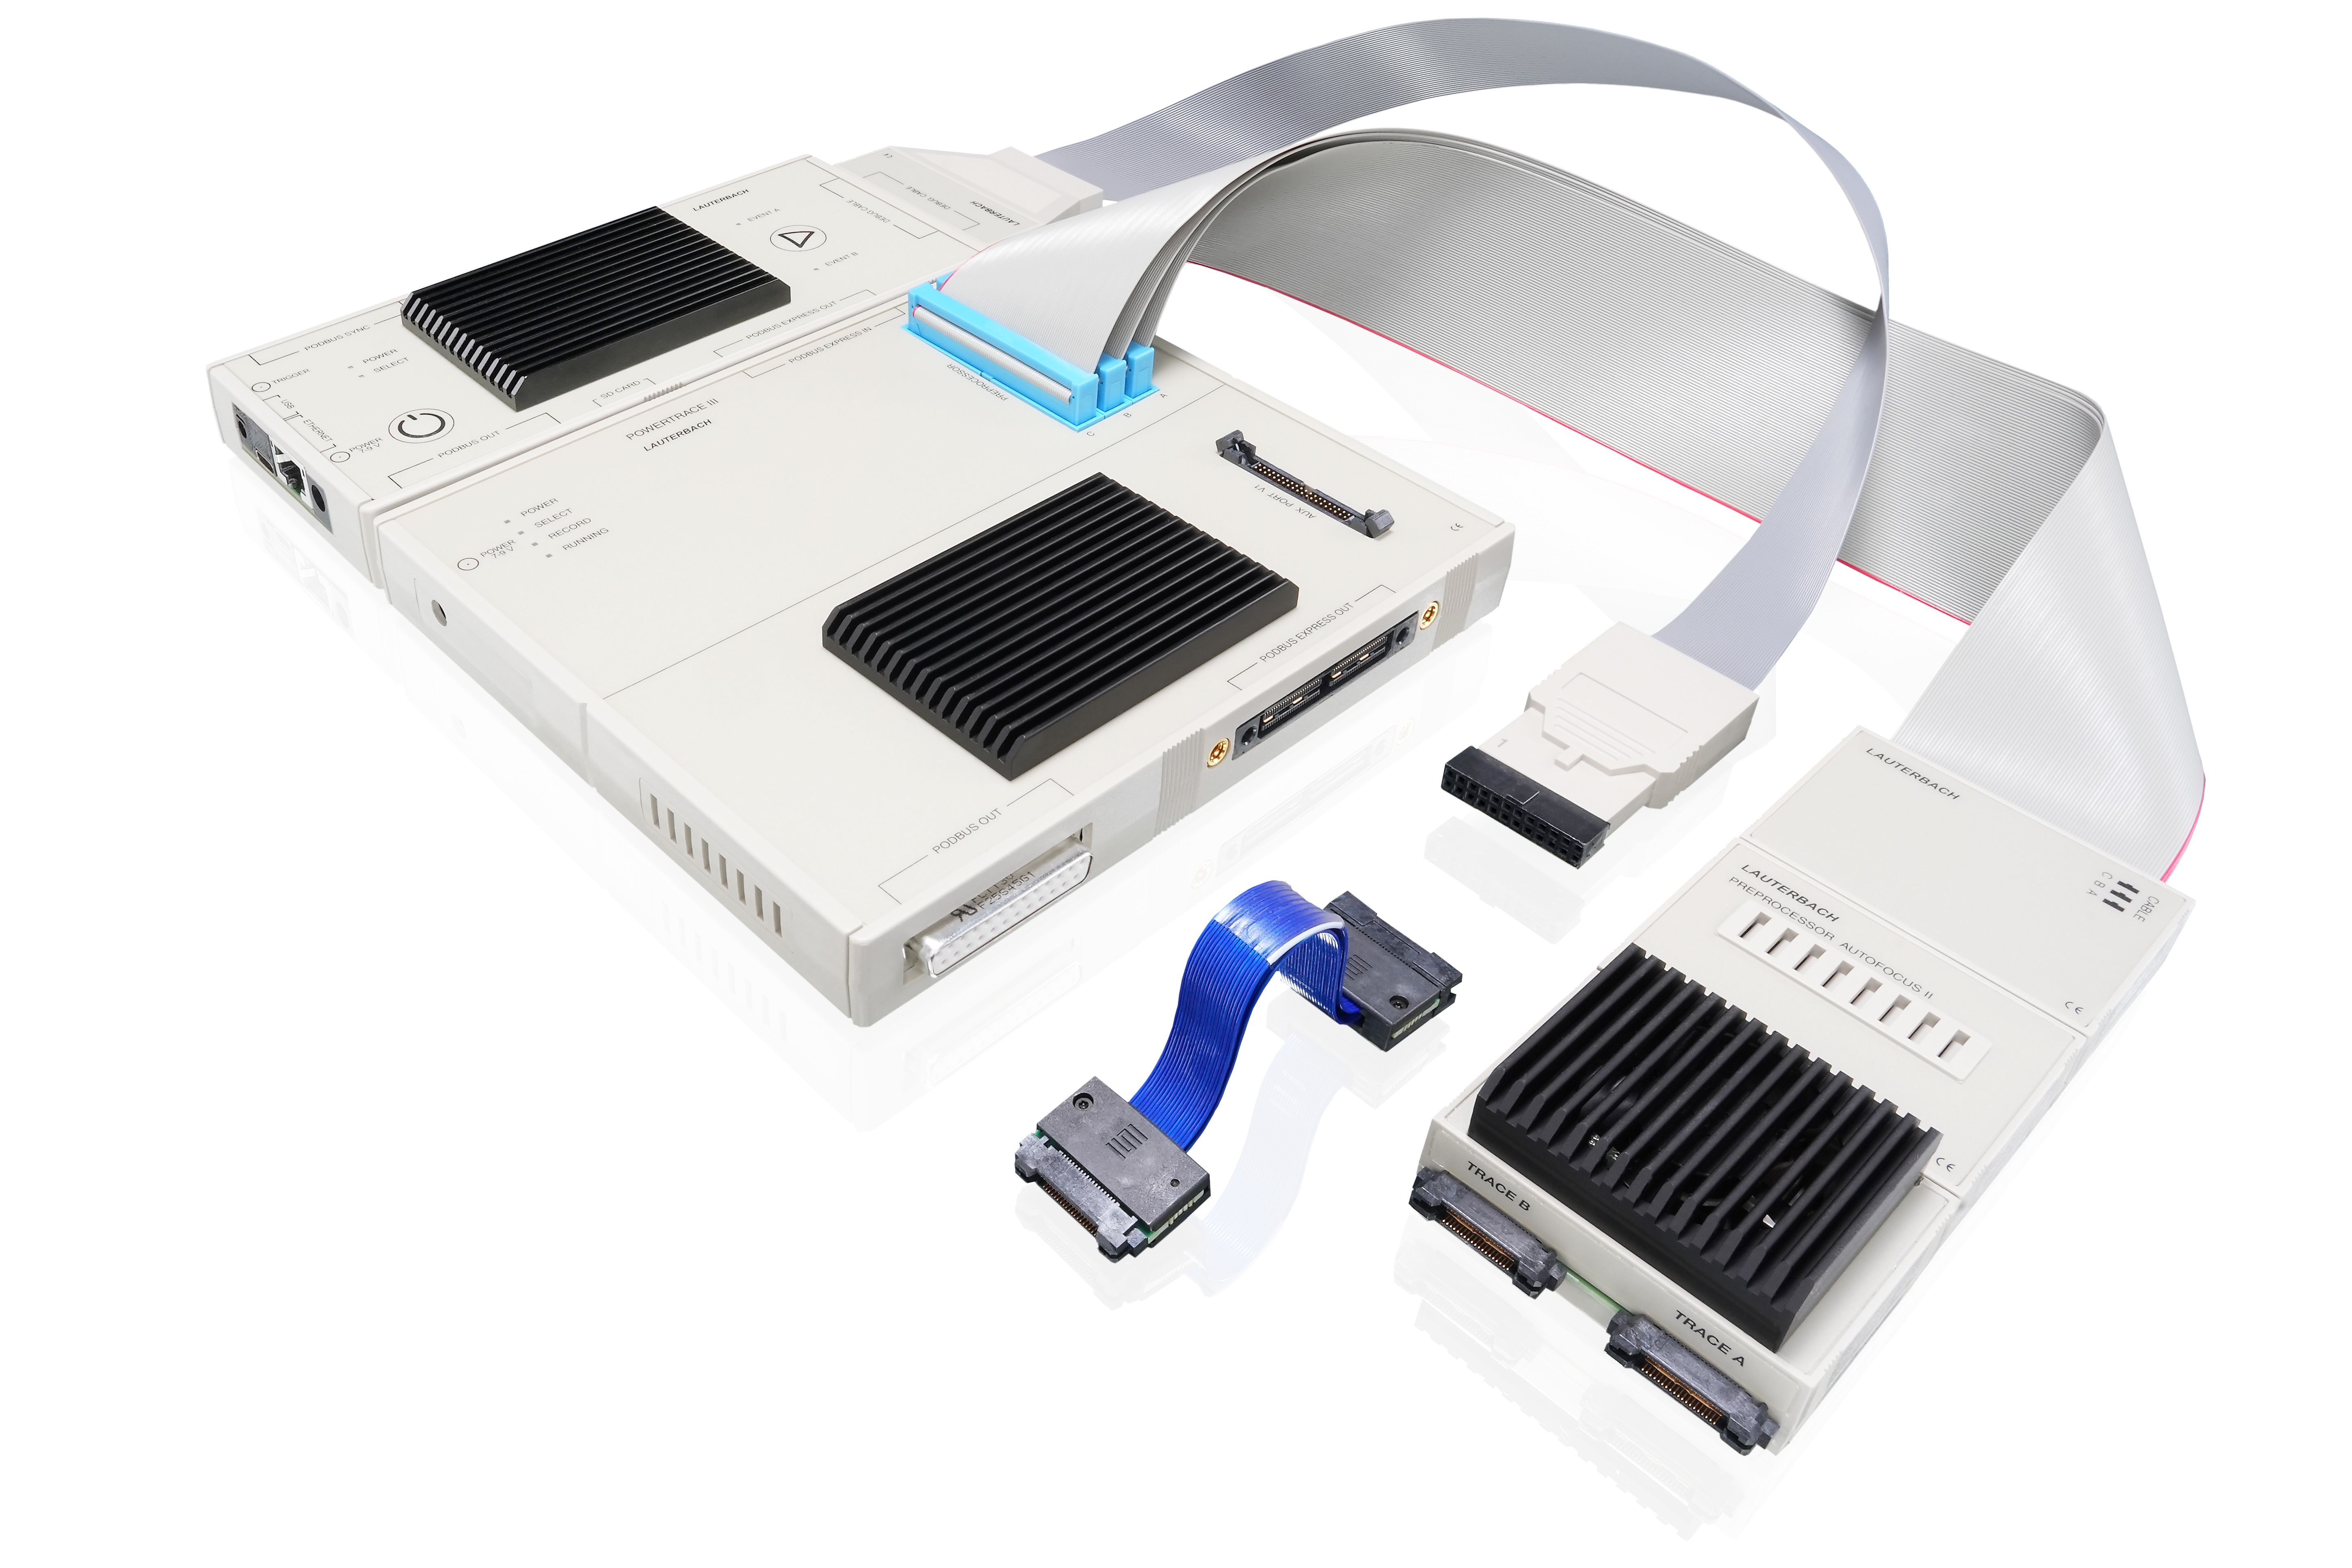
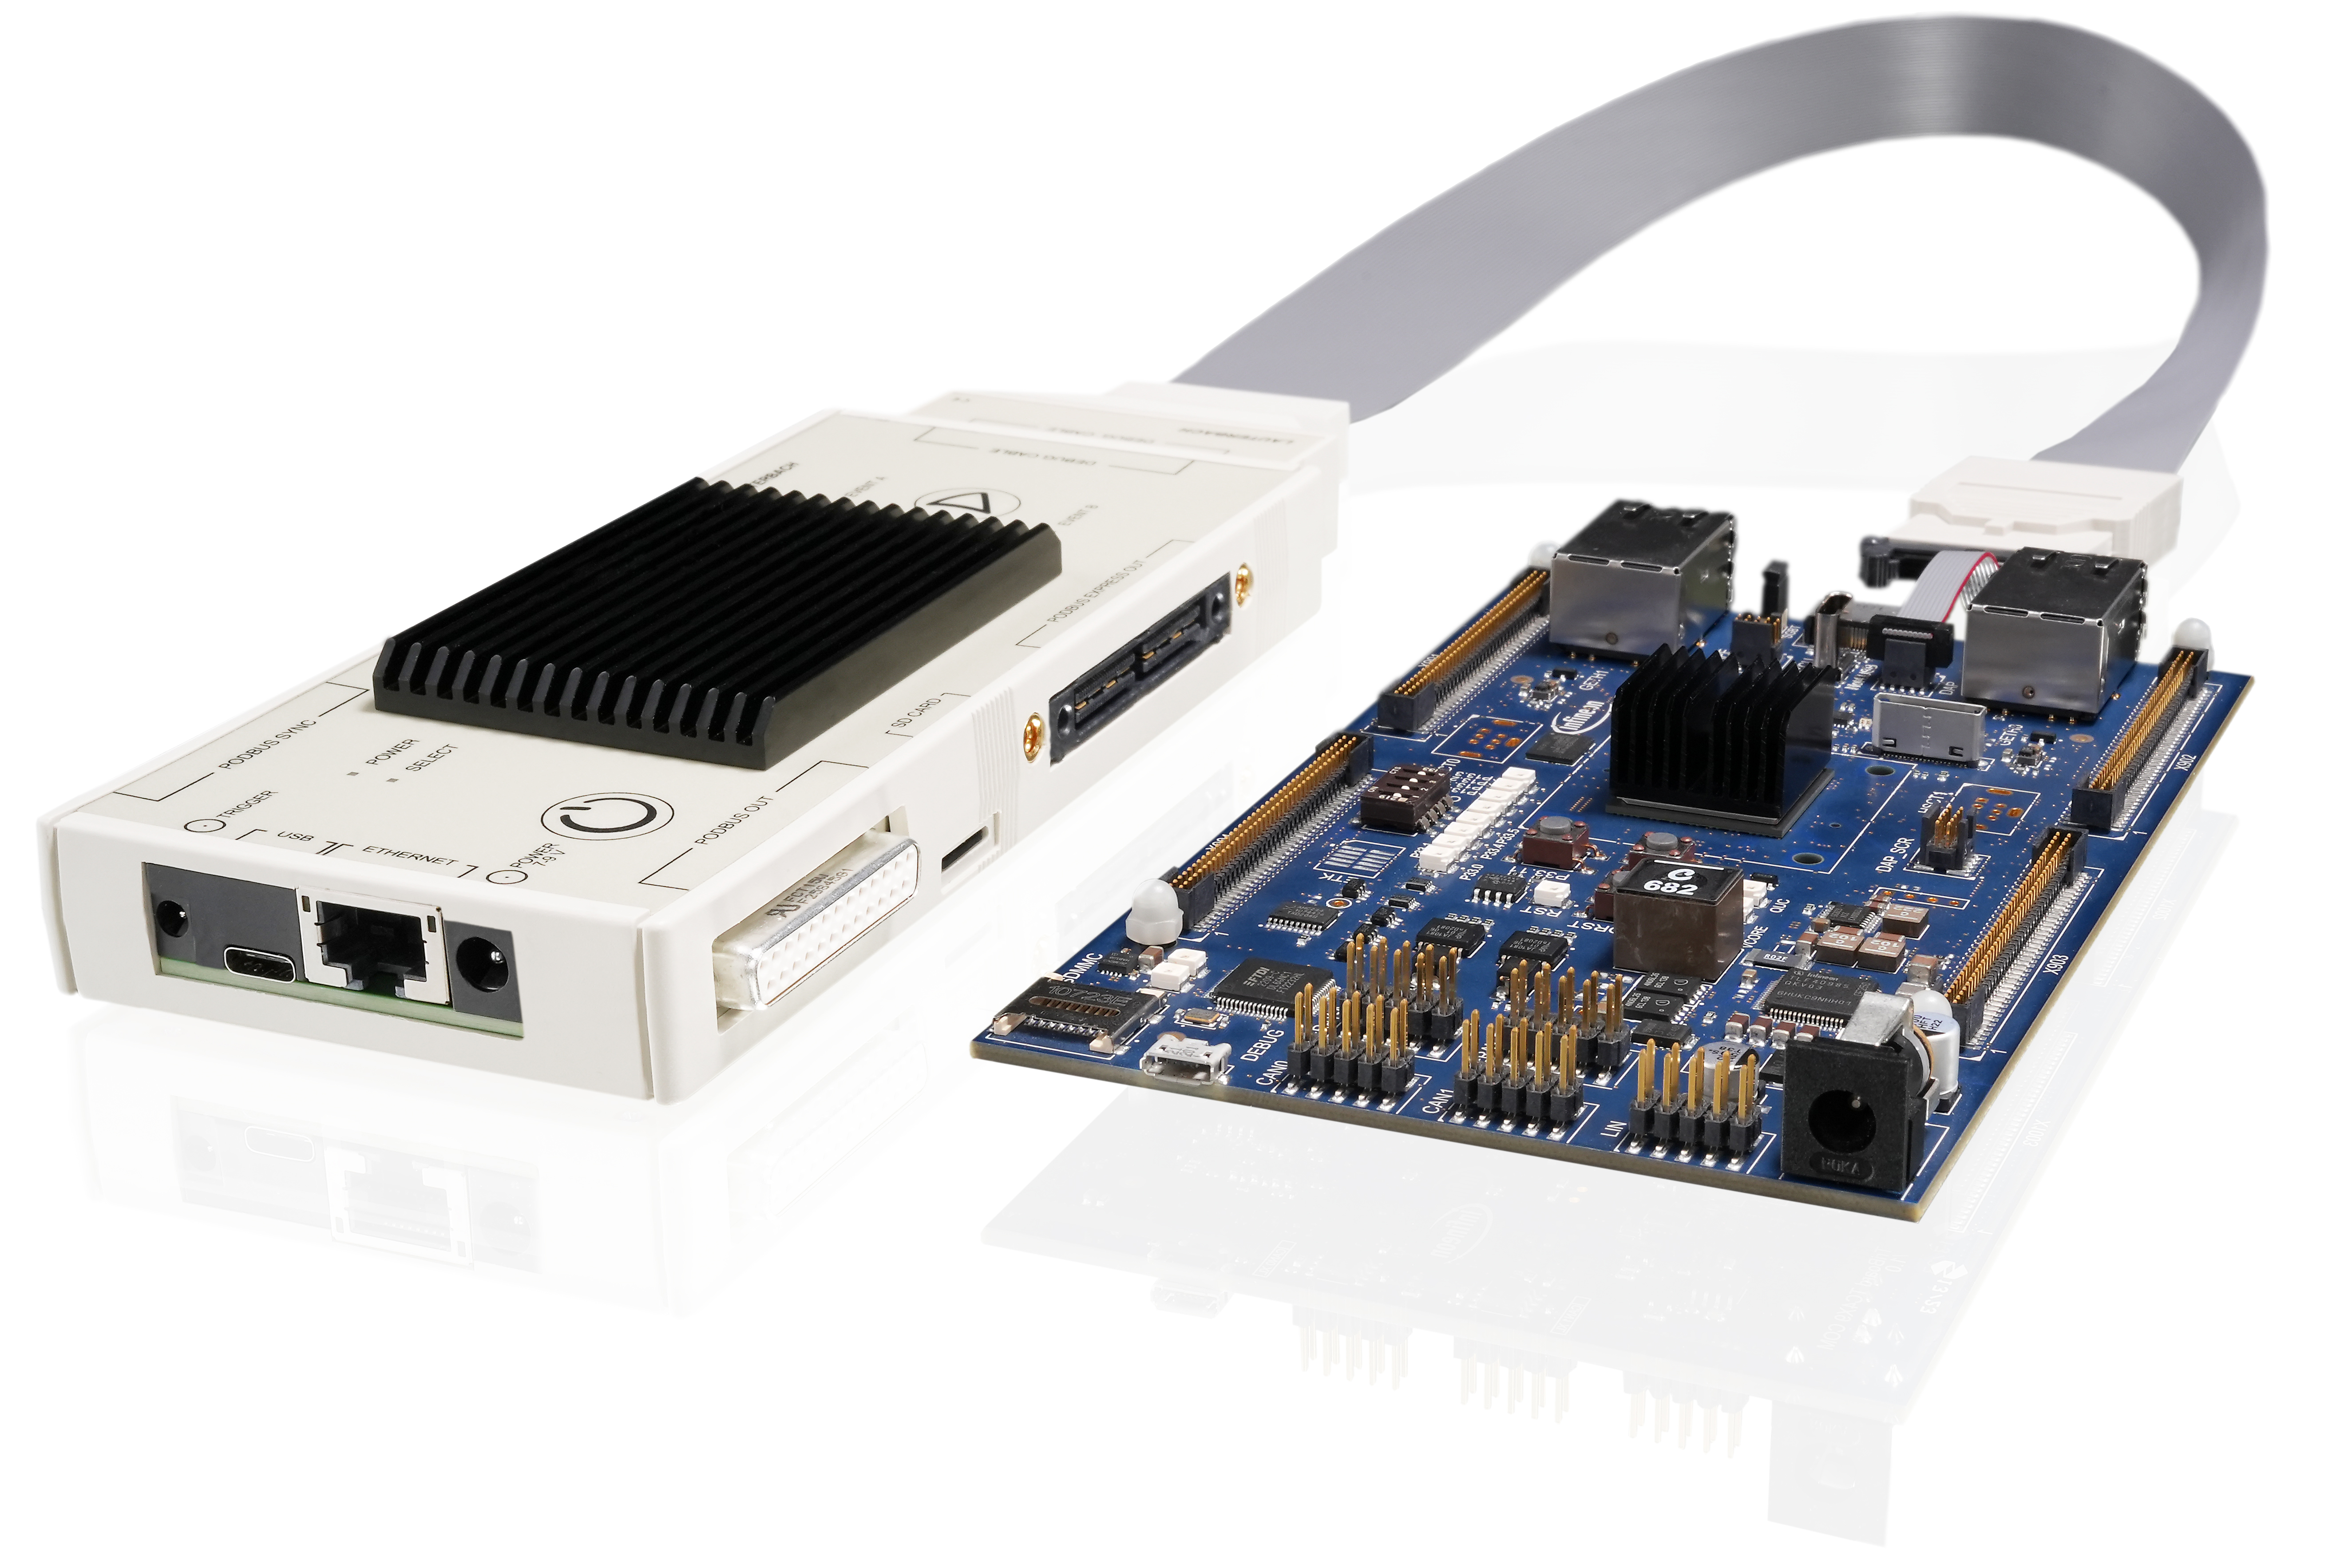
Debug & High-bandwidth Parallel Trace Configuration
Where the target provides a high-bandwidth parallel trace interface as well as a debug port, the ideal solution is to add a universal PowerTrace module and a target specific trace preprocessor. It gives you access to highly detailed run-time information about the embedded system without interfering with any of its real-time aspects. This allows you to perform a variety of analyses, including run-time performance measurements, task switch monitoring, code coverage analysis, and more.
Products shown:
- Power Debug X51
- IDC20A Debug Probe
- PowerTrace III
- AutoFocus II Trace Preprocessor
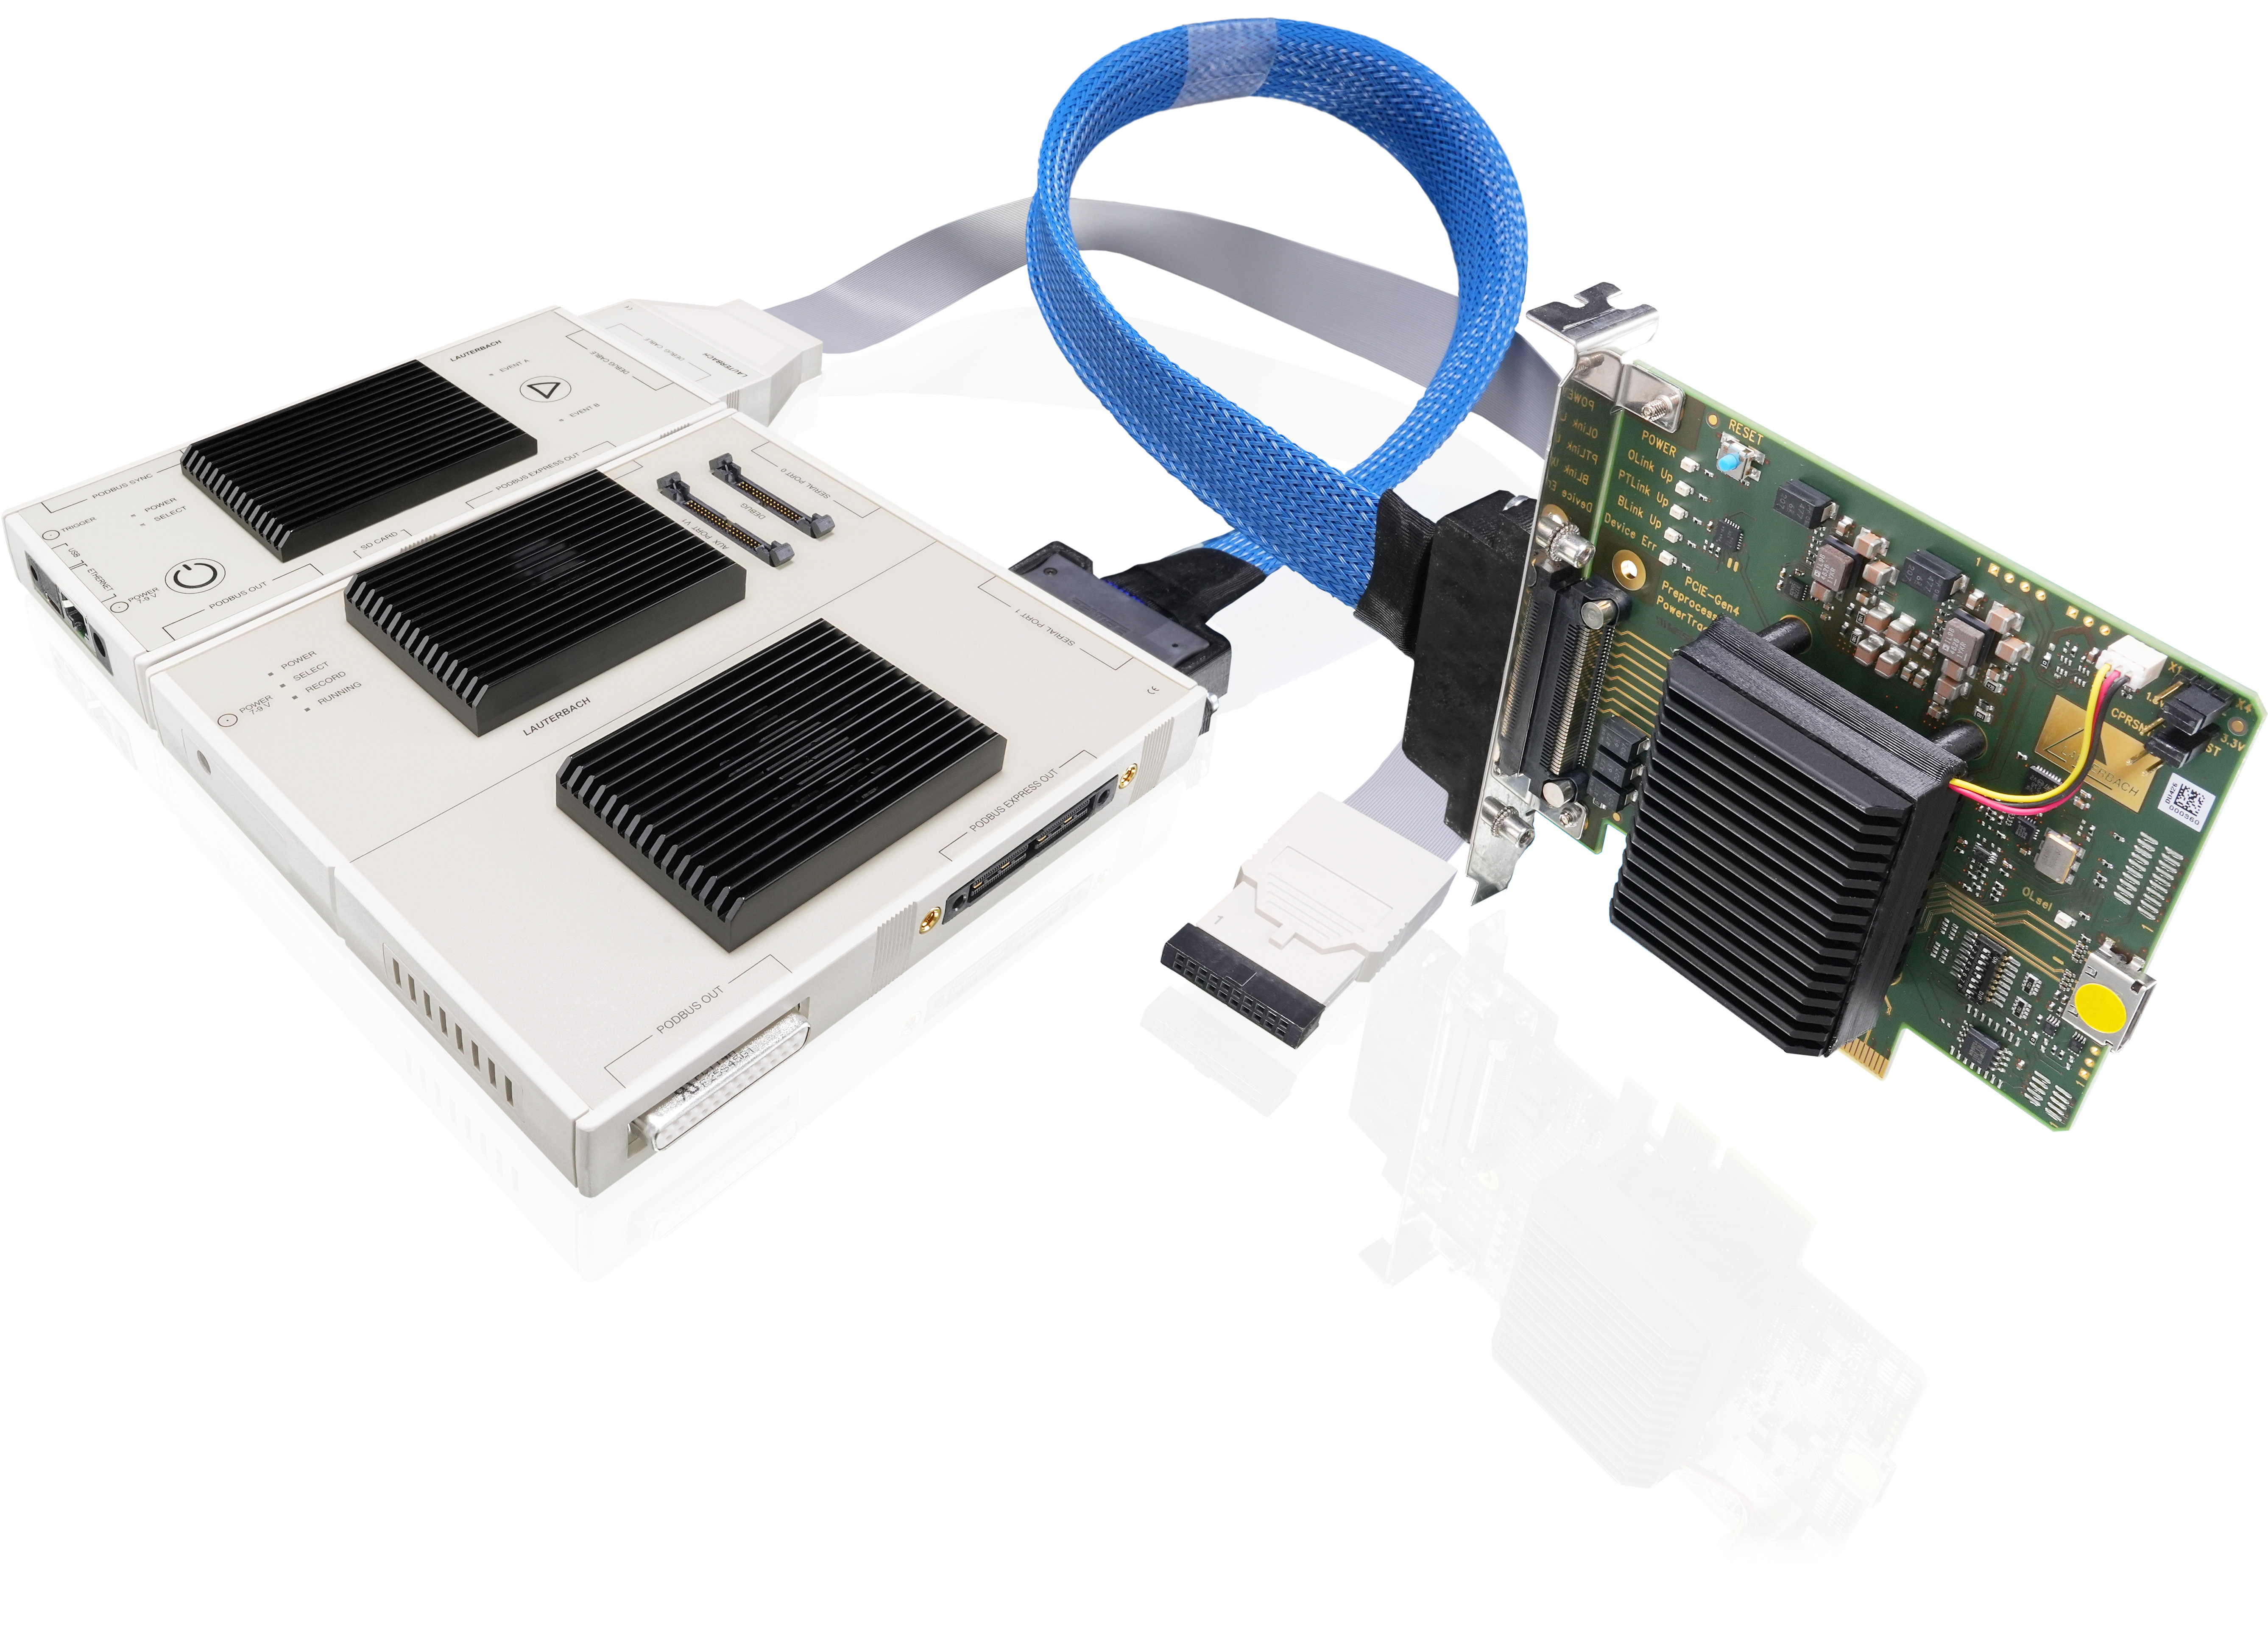
Debug & High-Speed Serial Trace Configuration
Increasingly, targets are opting for high-speed serial trace interfaces, which require fewer pins but operate at much higher clock speeds. Adding a PowerTrace Serial to your system will allow you to sample up to 8 lanes of Aurora, PCIe, or HSSTP trace, all without interfering with the real-time performance of the target. This data can be used for numerous analysis features such as runtime analysis, or code coverage.
Products shown:
Compare Debug Base Modules
This product |
||||
 |
 |
 |
||
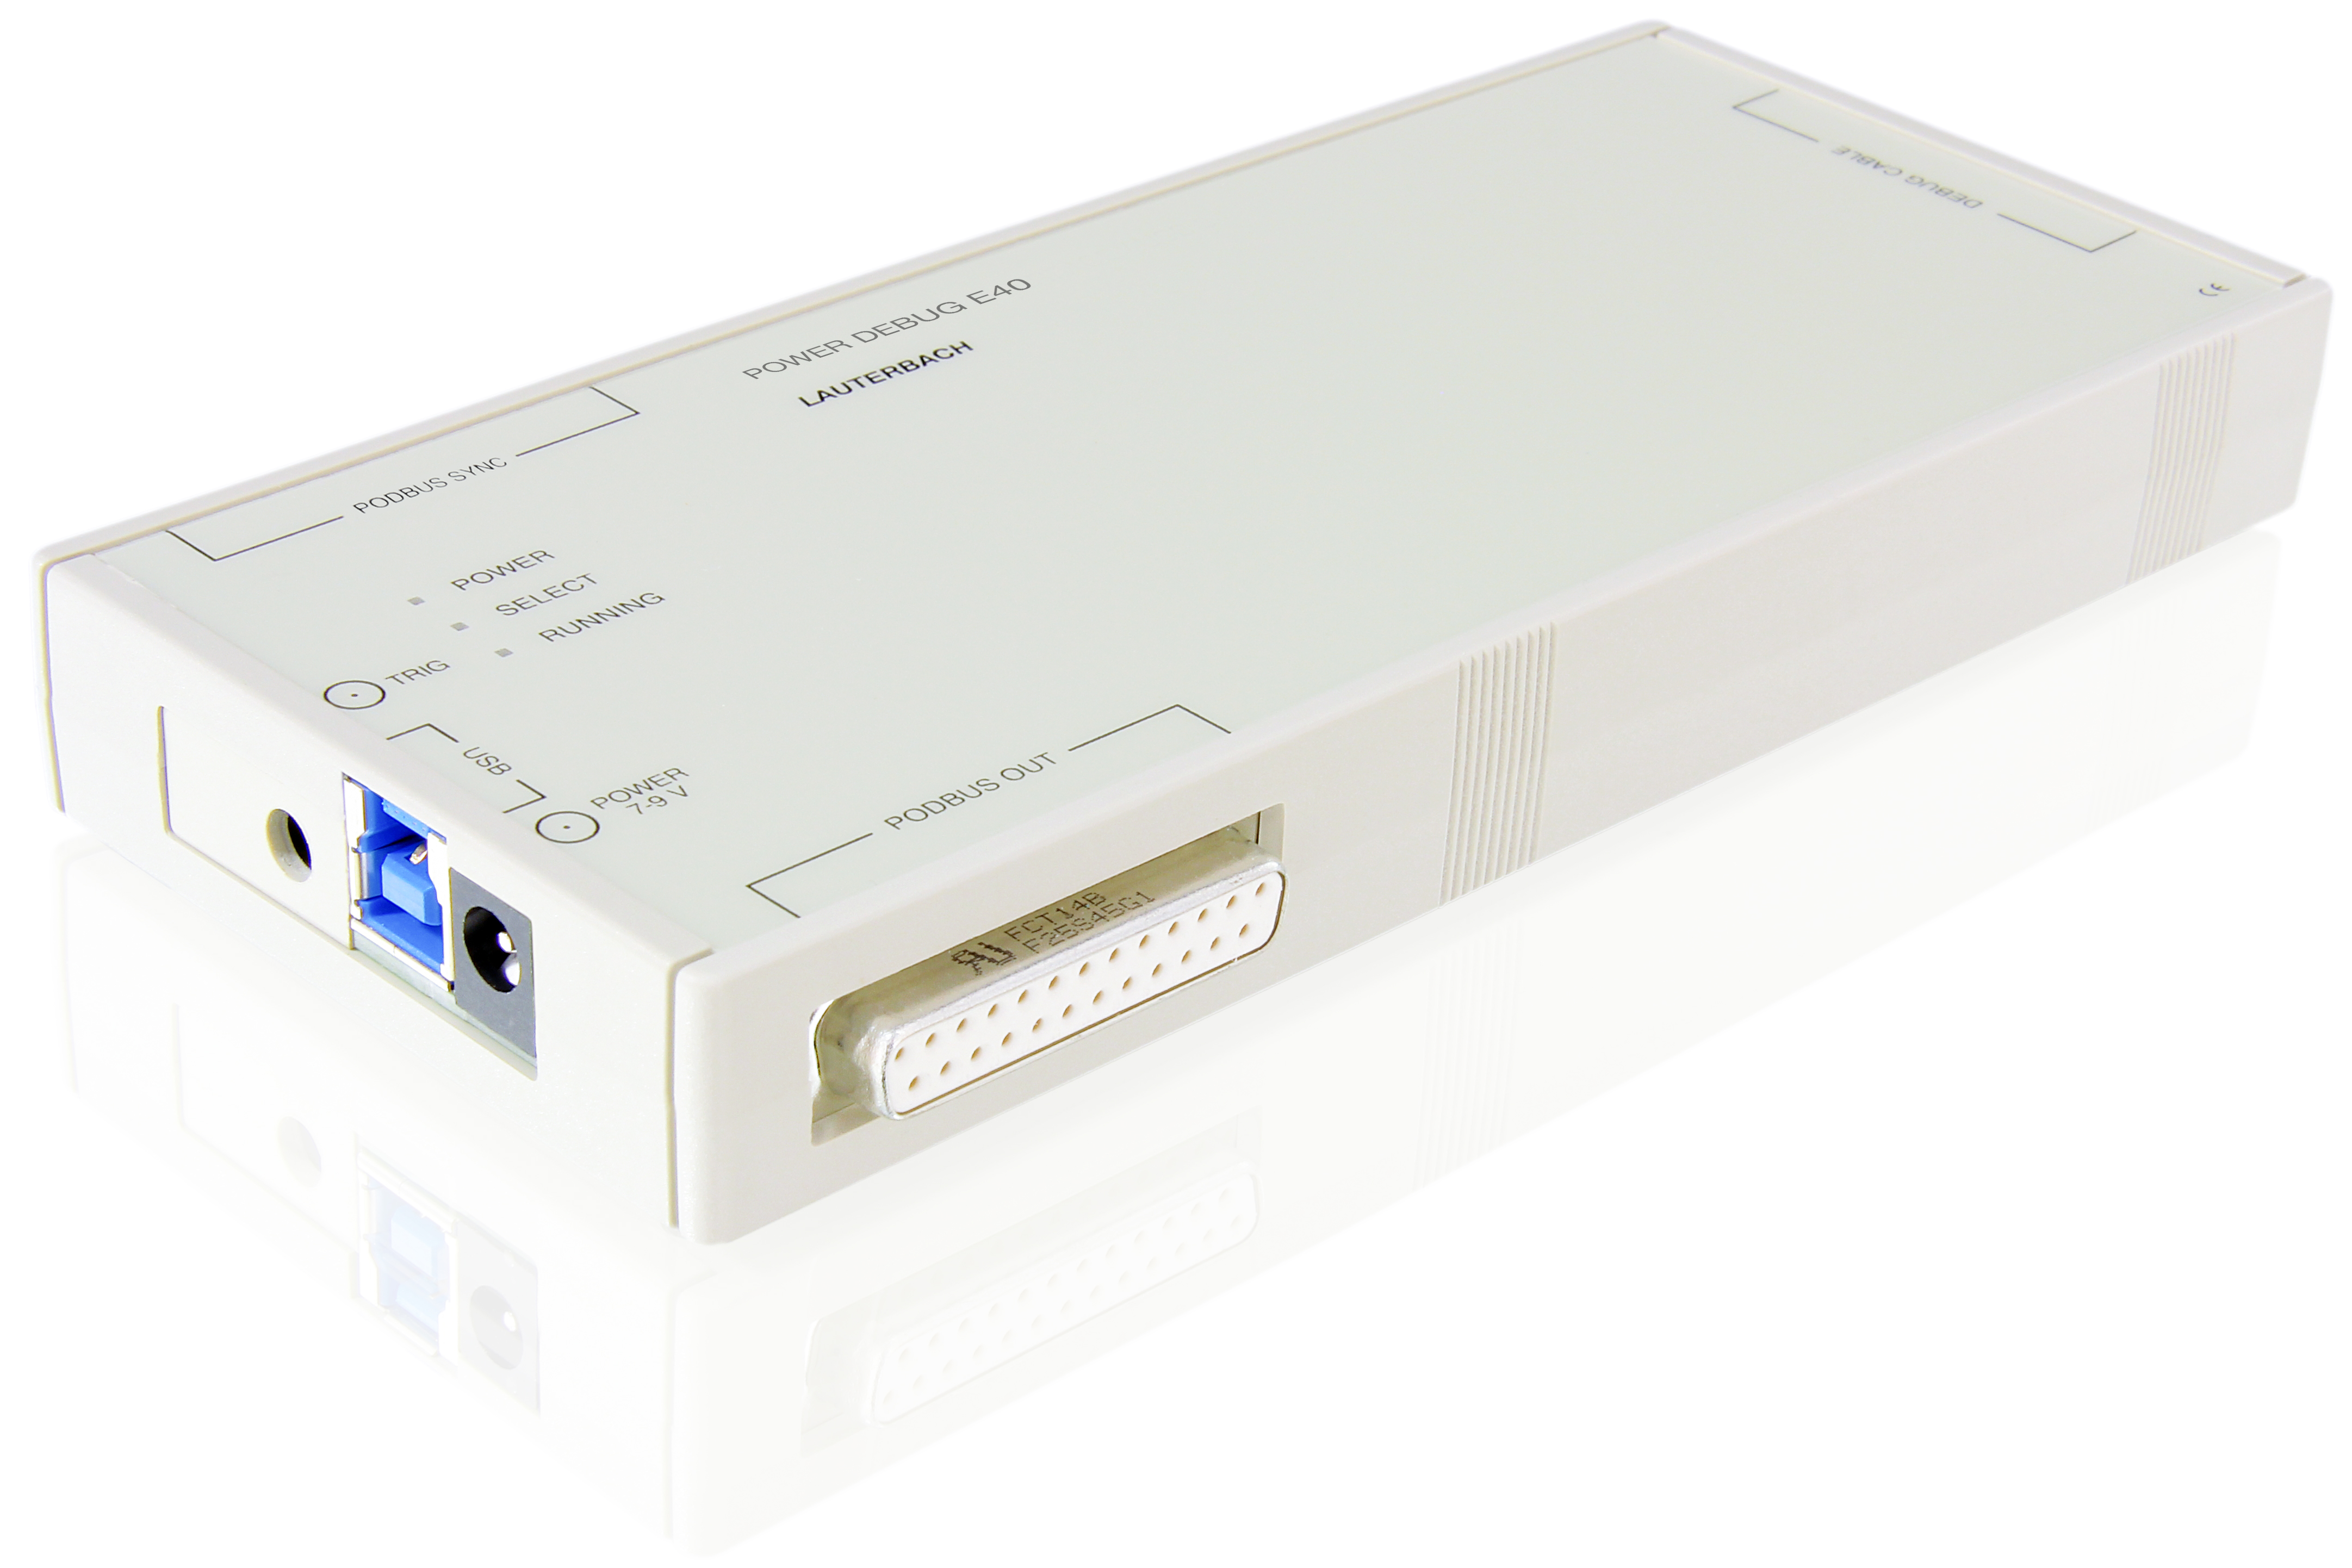
| Product | PowerDebug X51 | PowerDebug E40 | µTrace | |
| PC Interface | USB 3.2 Gen 1, Type C and 2.5 Gigabit Ethernet |
|
USB 3.2 Gen 1, Type B | |
| Voltage range | From 0.4 to 5.0 V* | From 0.4 to 5.0 V* | 1.2 to 5.0V | |
| Debug Protocols | JTAG, cJTAG, SWD, SWO, DAP and many more | JTAG, cJTAG, SWD, SWO, DAP and many more | JTAG, cJTAG, SWD, SWO | |
| Extension connectors | PodBus and PodBus Express | PodBus | None | |
| Possible trace extensions | CombiProbe 2, PowerTrace III, and PowerTrace Serial | CombiProbe 2 | Integrated 4-bit trace support (no extensions required). | |
| Possible logical analyzer extensions |
PowerIntegrator II, Mixed Signal Probe via CombiProbe 2 or PowerTrace III | Mixed Signal Probe via CombiProbe 2 | Mixed-Signal Probe | |
| Trigger Connector | Out 4.4V / In 3.3V (5V tolerant) | Out 4.4V / In 3.3V (5V tolerant) | Out 3.3V / In 3.3V (5V tolerant) | |
| Supported Architectures* | Over 150 microprocessor architectures | Over 150 microprocessor architectures | Arm Cortex-M and RISC V 32 bit | |
| See more | See more |
Request a Price Quotation

Universal debug controller of the Extended Connectivity Line (Gen 5) with 2.5 Gbit Ethernet (via TCP/IPv4 and TCP/IPv6) and USB-C 3.2 Gen1 for Windows/Linux/macOS. Can be extended via an optional PowerTrace trace module and PowerIntergrator logic analyzer. Requires a TRACE32 Debug Cable or CombiProbe. Requires TRACE32 software release R.2024.09 or newer. Requires a PC or Mac running Windows, Linux or macOS. SD card slot for standalone operation can be enabled via PowerView software. See more at www.lauterbach.com/x51