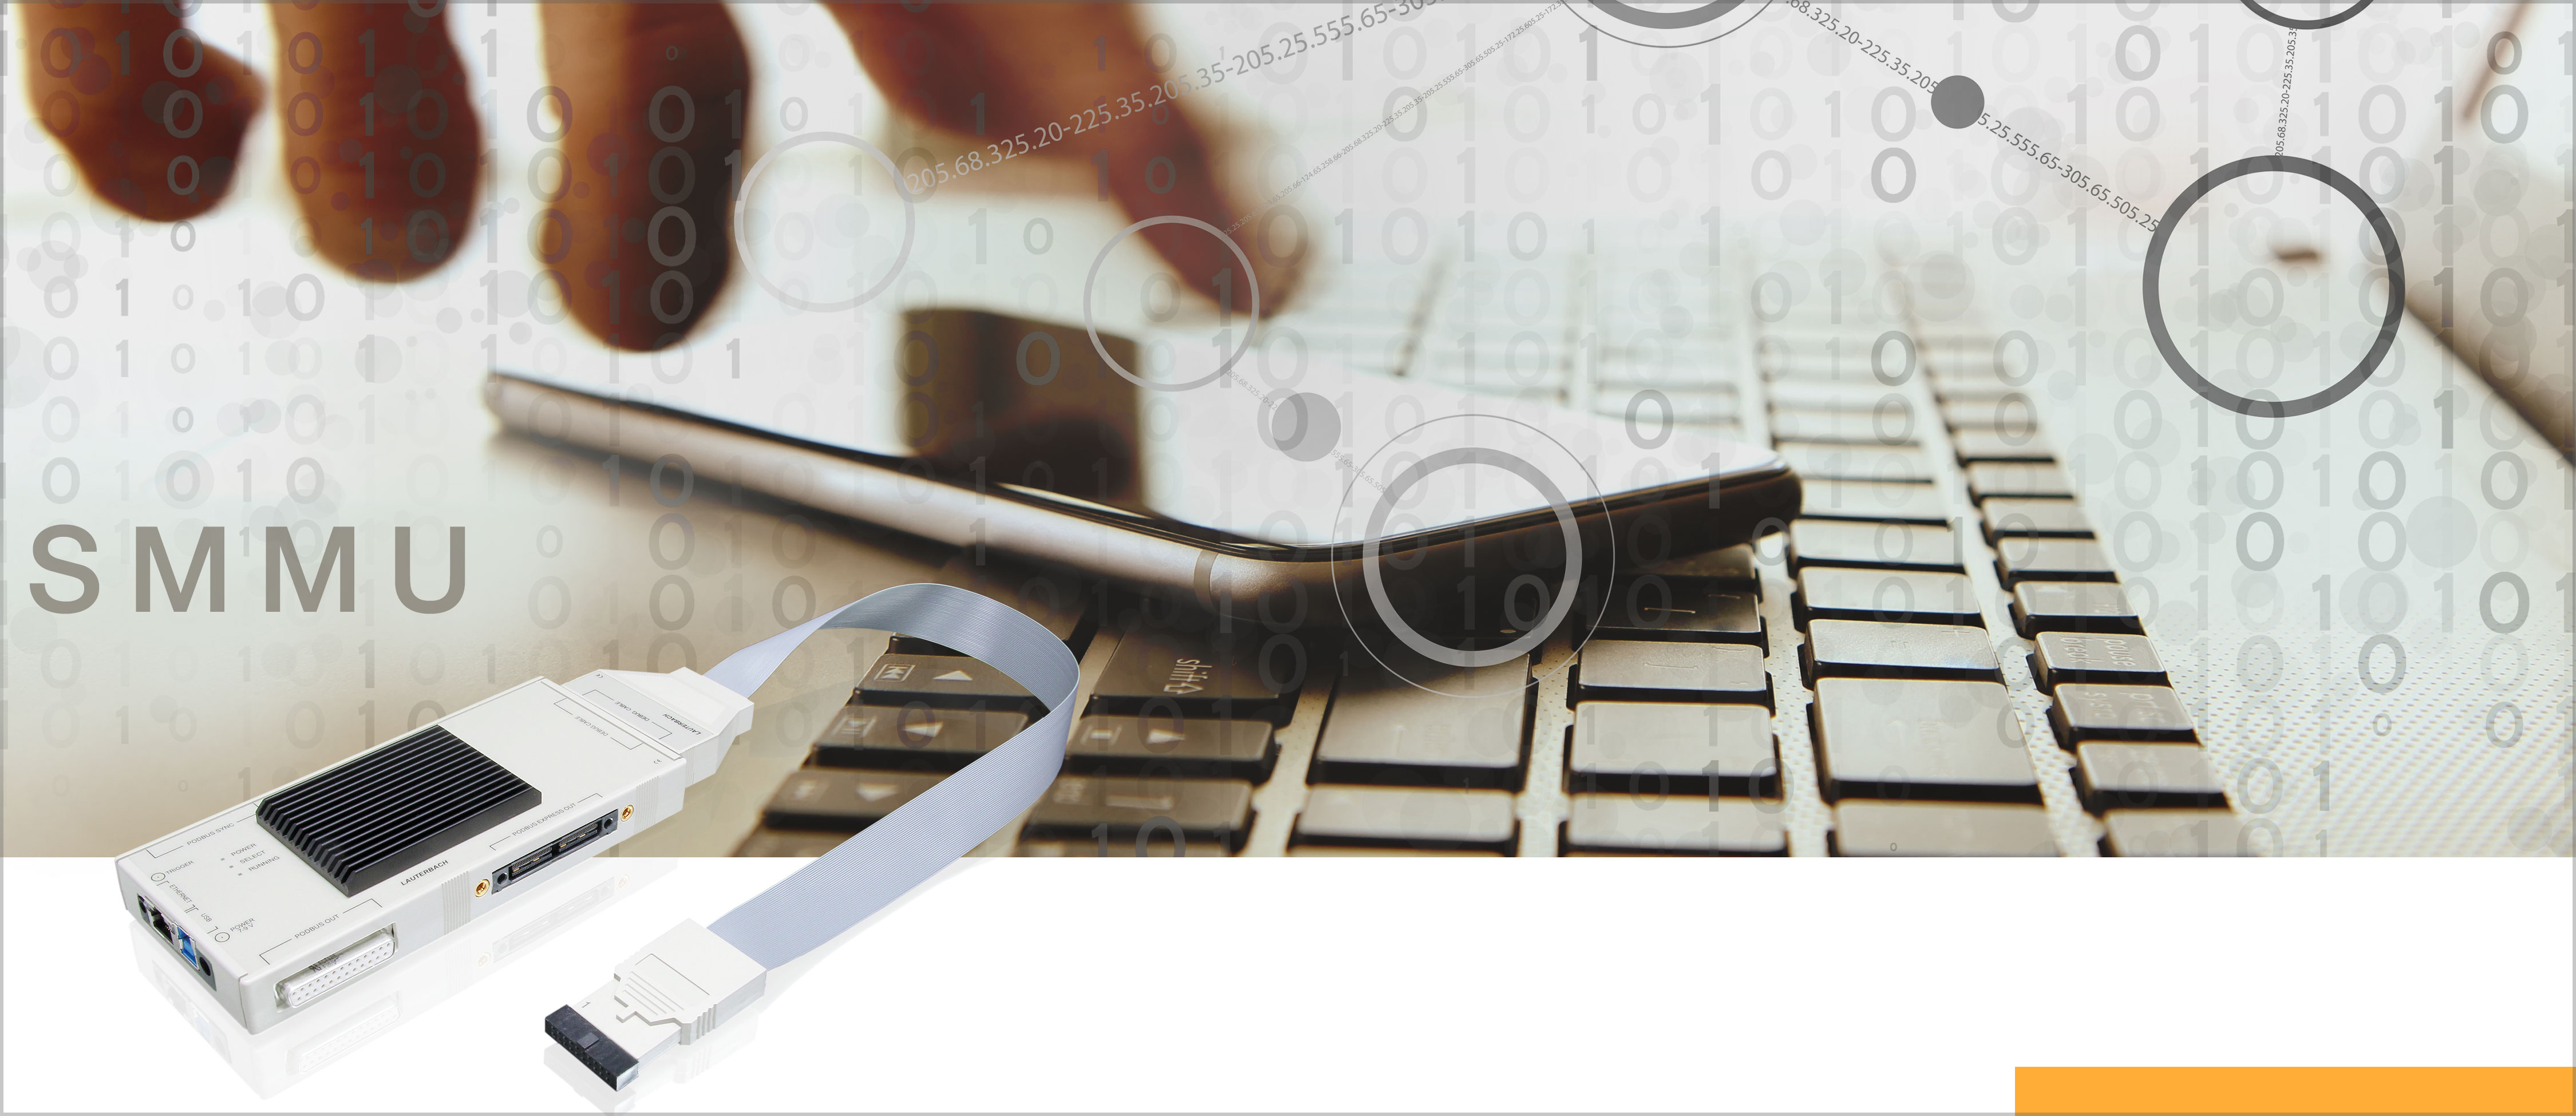
Lauterbach´s TRACE32 Provides Full Debug Support for Arm´s SMMU
Lauterbach´s TRACE32® tools offer full debug support of Arm´s System Memory Management Unit (SMMU) which is available in most current Arm® Cortex®-A
based SoCs. SMMUs are important building blocks in Arm based chips
running virtualized systems, where multiple guest operating systems are
managed by a hypervisor. They independently perform address translations
from virtual to physical addresses for peripherals which are capable of
performing Direct Memory Access (DMA).
Lauterbach´s TRACE32 tools allow convenient debugging of Arm SMMUs via
the TRACE32 PowerView GUI, commands, and scripting. Users are provided
with an easy to use and intuitive interface to the SMMU configuration.
For debugging, they can view stream and sub-stream configurations,
stage-1 and stage-2 page tables of the address translation, events and
fault conditions as well as viewing SMMU registers and fields by name.
Currently, MMU-400, MMU-401, MMU-500, and MMU-600 are fully supported
with MMU-700 to follow shortly.
“We are pleased to provide our customers with an efficient solution for
debugging and tracing complex SoC’s without requiring detailed knowledge
of the interaction between the multiple operating systems, as the
complex decoding of the SMMU configuration is performed by our TRACE32
tools. This allows the user to focus solely on the development and debug
process,” says Dr. Philipp Kröner, System Engineer at Lauterbach GmbH.
If you are interested in detailed information about the debug support for your Arm SMMU, please contact our local engineers.
On this page, you can download our Lauterbach News for Print and Social Media. If you have any questions concerning the publication, please contact Evi Ederer: press@lauterbach.com

