µTrace®


Cost-Effective All-In-One Debug and Trace Module
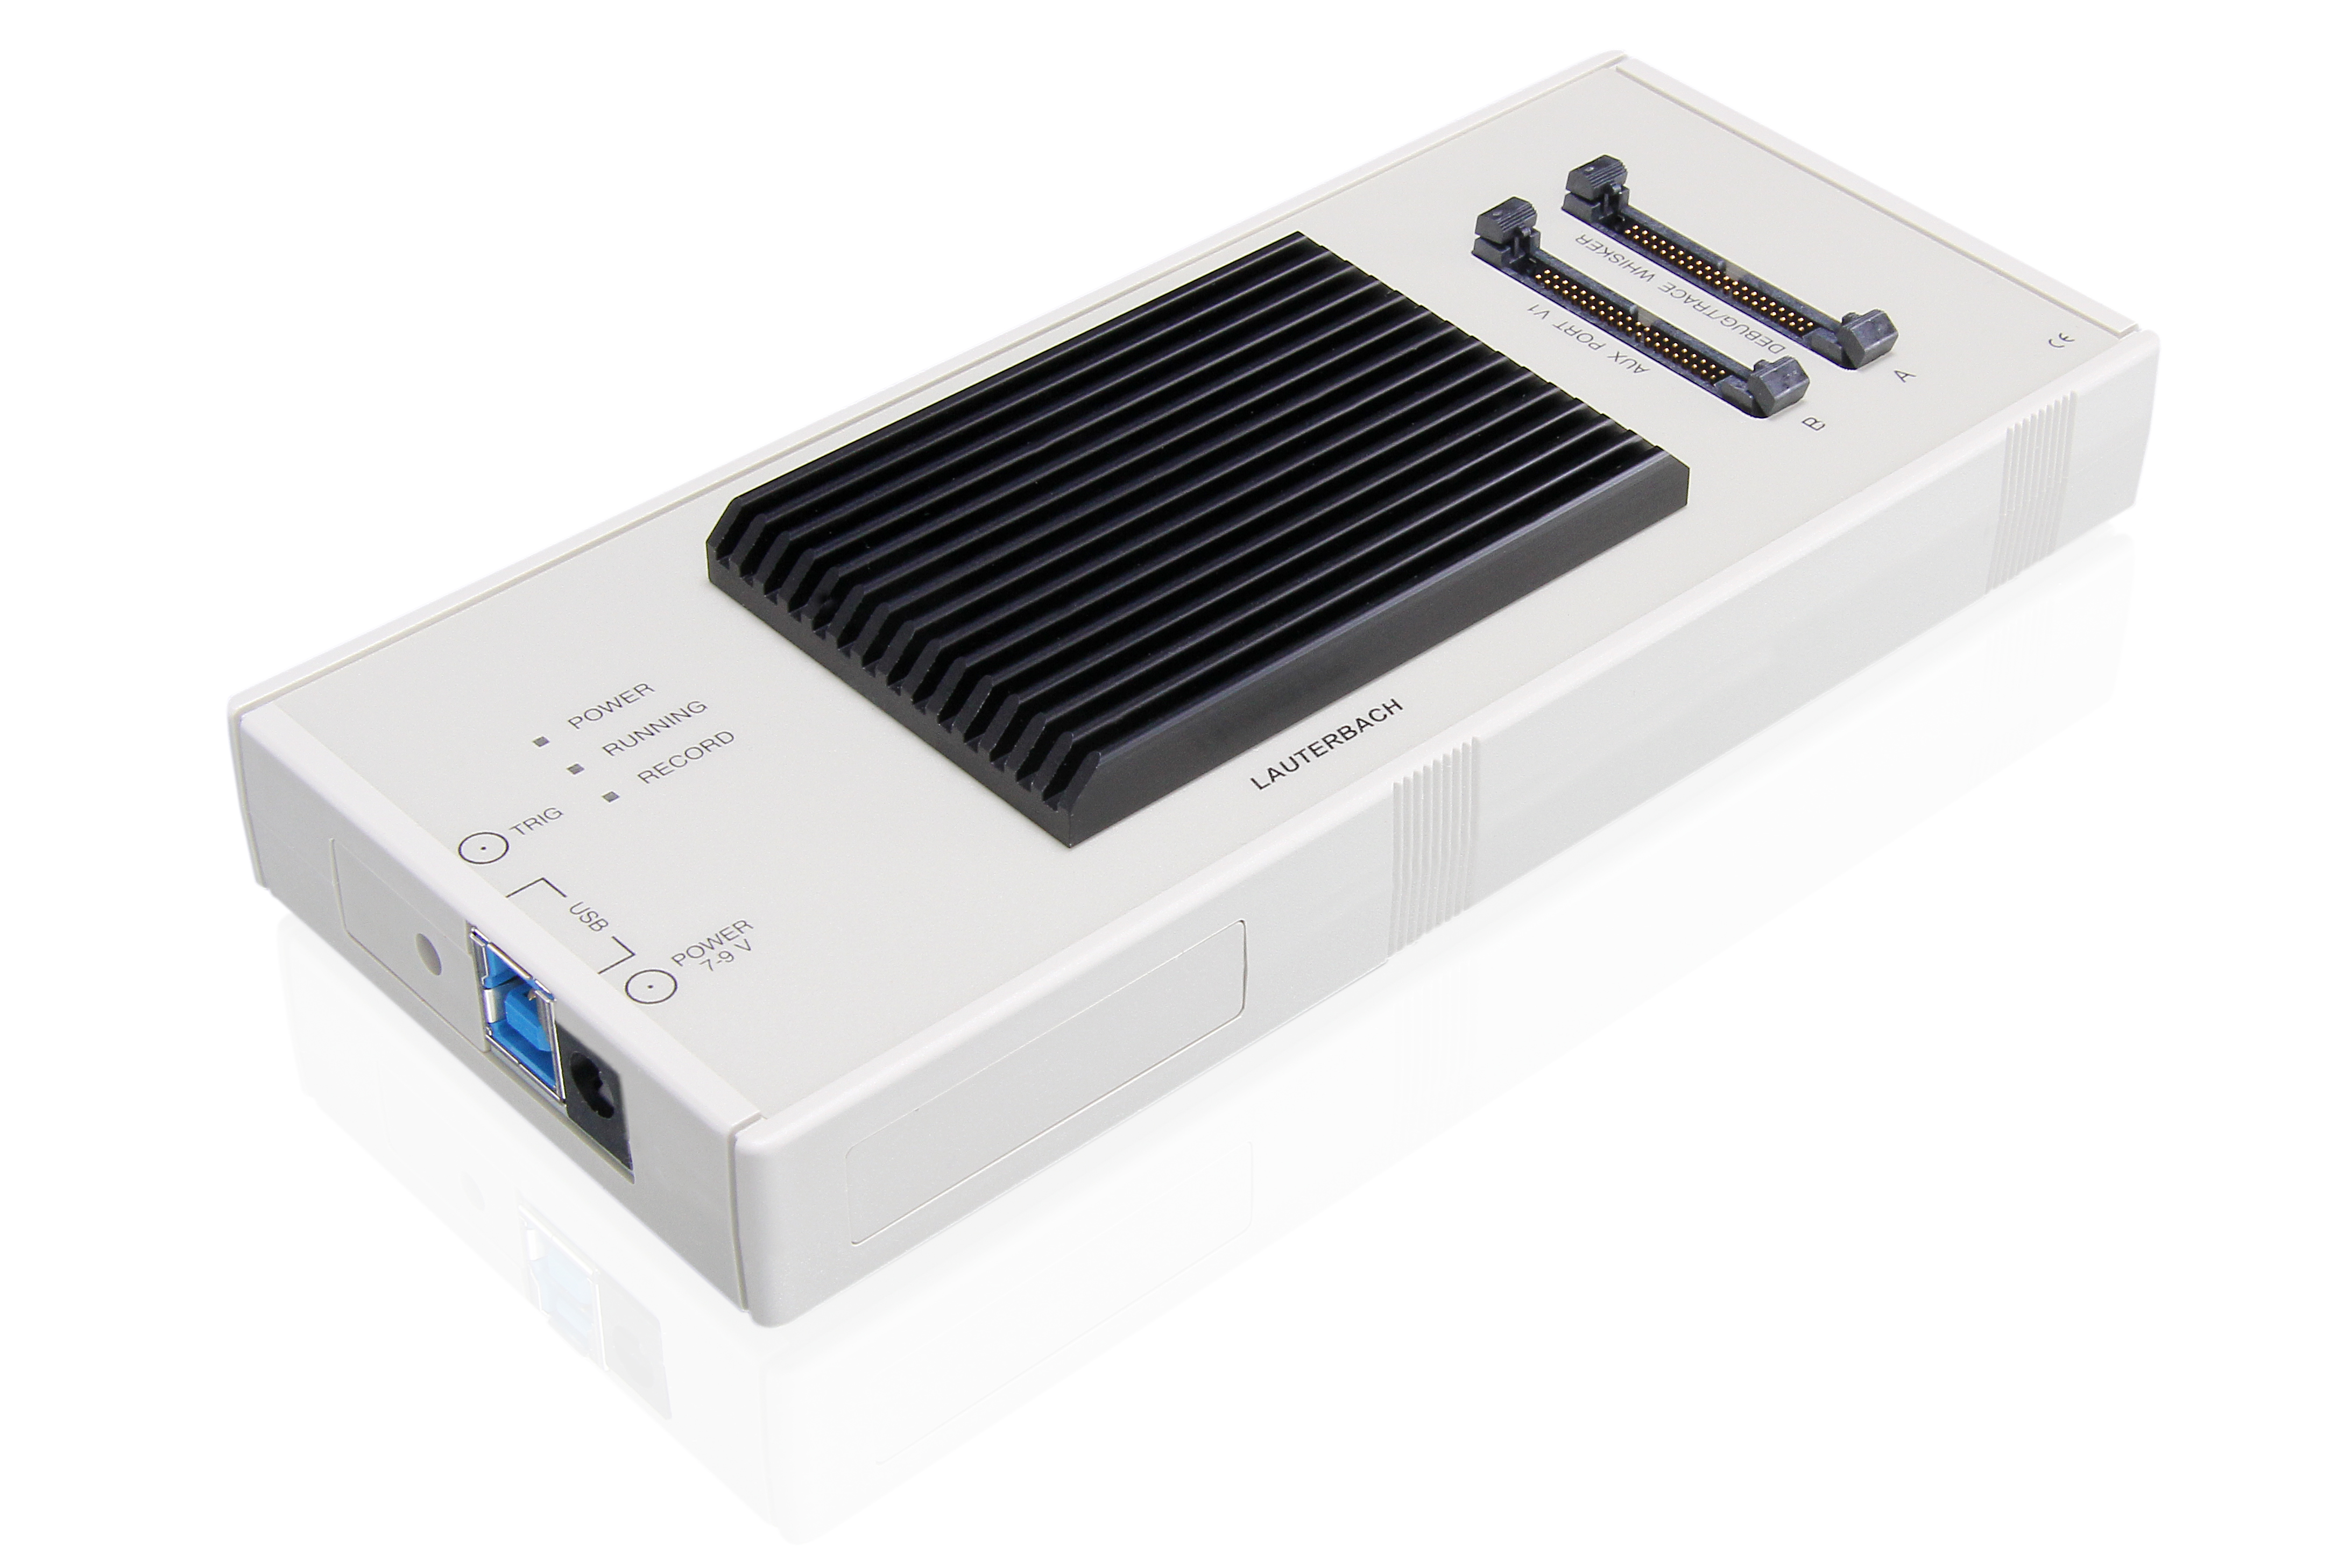
Leverage the power of a full debug and trace system specifically geared towards your embedded design. µTrace® is our cost-effective all-in-one solution that provides all functions for Arm® Cortex®-M or RISC-V RV32 cores, and shines especially for microcontrollers with a parallel trace port of up to 4 pins.
Enjoy Uncompromising Lauterbach Quality, Functionality and Support
µTrace® provides you the same features that our industry leading high-end products are known for: highest quality, exceptional functionality and superior support. In addition to its leading debug capabilities, µTrace® can capture real-time information like system traces and parallel flow traces, enabling e.g. Code Coverage and Code Profiling. In many use cases, real-time trace can bring embedded designs to market faster, safer and with more reliability.
Leverage the Highest Performance in the Industry
Our µTrace® supports data rates up to 400 Mbit/s per trace line from the Arm® CoreSight™ Trace Port Interface Unit (TPIU) or the RISC-V Pin Interface Block (PIB). This is 30 percent faster than competing trace tools for embedded systems. To ensure proper sampling at these speeds, our AutoFocus eye-finder automatically detects the perfect sampling point for each trace line.
Trace Ultra Long with Highest Streaming Performance
Capture extremely long-term trace recordings by streaming the trace data to your host PC for later analysis. An average streaming speed of 140 MB/s (1.2 Gbit/s) ensures a reliable transfer without data loss and represents the highest data rate in this market segment. Our TRACE32® PowerView Software updates and displays the code coverage results on-the-fly, while the target is running.
Squeeze the Last Milliwatt Out of Your Application
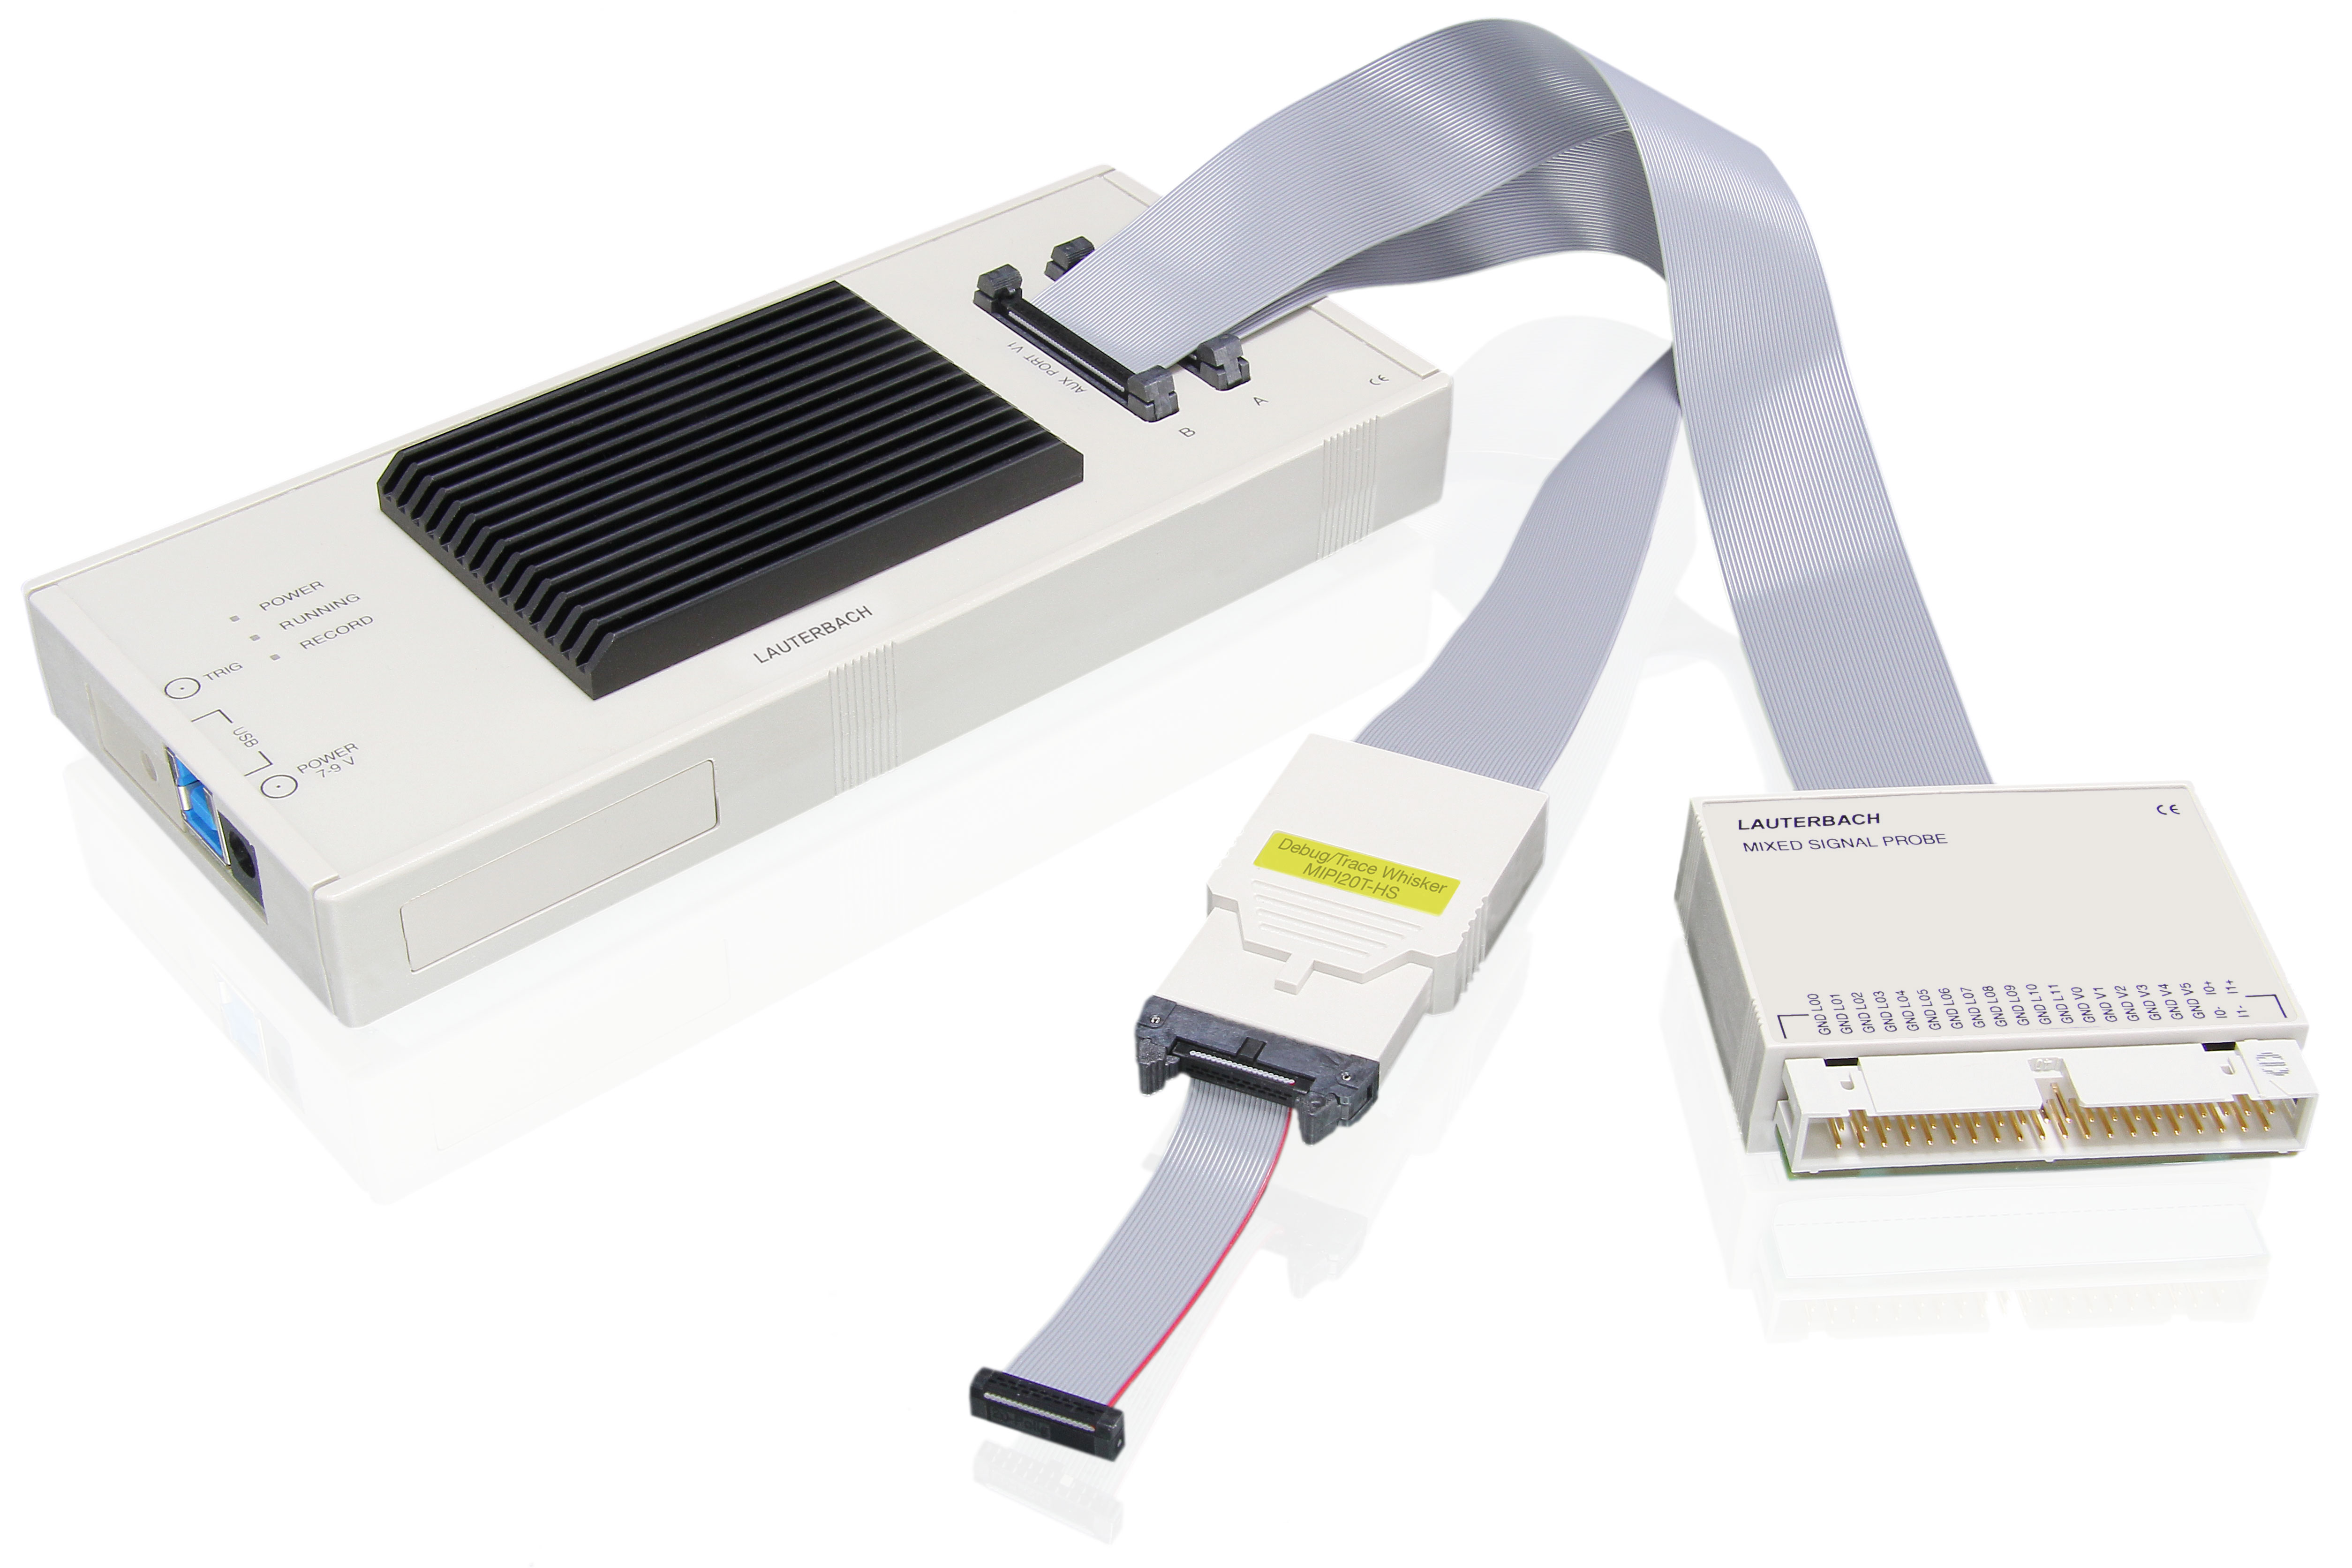
By adding our optional Mixed-Signal Probe, your µTrace® can record detailed measurements of the power consumption of your embedded system over time. If your microcontroller additionally supports off-chip trace, you can perform Energy Profiling to locate all power-hungry code sections, which is especially important in power sensitive applications.
Observe Your SoC from the Inside and Outside
In combination with the Mixed-Signal Probe, your µTrace® can sample analog and digital signals and decode the protocols send on digital lines. If your microcontroller support program flow trace, the recorded signals can be correlated, drawing a coherent picture of what is happening simultaneously inside the chip and outside at the pins and peripherals of your SoC package.
Debug Any Cortex-M and Any RV32 Chip - Including Hidden Cores
By using our µTrace® you can debug an industry-leading number of Cortex-M and RV32 cores implemented in both single-core and multi-core microcontrollers and SoCs: today we support over 7,000 chips supplied by dozens of manufacturers. New chips are regularly added, and we often support new chip designs as they are announced. Beyond our extensive support of publicly known IP, it can also debug cores that are never publicly announced, keeping your confidential IP your own secret.
Enjoy Our Full Feature Set and a Familiar User Interface
With PowerView, we have developed a unique user interface that remains consistent across our products and supported OSes. Using µTrace®, you benefit from our full debug and trace functionality and can get started immediately without any additional training.
Technical Data for µTrace®
This product |
||||
| Product | PowerDebug X50 + PowerTrace | PowerDebug E40 + CombiProbe 2 |
µTrace® for Cortex-M | µTrace® for RISC-V |
| PC Interface | USB 3 / Gigabit Ethernet | USB 3 | USB 3 | USB 3 |
| Voltage range | from 0.4 to 5.0 V 1 | from 1.2 to 5.0 V 5 | 1.2 to 5.0V | 1.2 to 5.0V |
| Debug Protocols | JTAG, cJTAG, SWD, DAP and many more | JTAG, cJTAG, SWD, DAP and many more | JTAG, cJTAG, SWD |
JTAG, cJTAG, SWD |
| Extension connectors | PodBus and PodBus Express | PodBus | N/A | N/A |
| Trace Port Width (Max.) | 32 parallel lines2 or 8 serial lanes3 | two ports with 4 parallel lines | 4 parallel lines | 4 parallel lines |
| Trace Recording Speed (Max.) | 600+ Mbit/s per parallel line2 22.5 Gbit/s per serial lane3 | 400 Mbit/s per line | 400 Mbit/s per line | 400 Mbit/s per line |
| Trace Streaming Performance4 (Peak / Average) | up to 2 400 / 400 MByte/s | up to 200 / 140 MByte/s | up to 200 / 140 MByte/s | up to 200 / 140 MByte/s |
| Trace Memory Size | 8 GByte | 512 MByte | 256 MByte | 256 MByte |
| Option for logic analyzer and energy profiling | Mixed Signal Probe | Mixed Signal Probe | Mixed-Signal Probe | Mixed-Signal Probe |
| Trigger Connector | 4.4V out / 3.3V in (5V tolerant) | 4.4V out / 3.3V in (5V tolerant) | 3.3V out / 3.3V in (5V tolerant) | 3.3V out / 3.3V in (5V tolerant) |
| Supported Architectures1 | Over 150 microprocessor architectures | Over 150 microprocessor architectures | Arm Cortex-M | RISC-V 32-bit (RV32) |
1 Depends on the debug probe used.
2 With PowerTrace III
3 With PowerTrace Serial 2
4 The streaming rate defines the per-second throughput of data that can be transferred on-the-fly to the PC. If the trace-port rate is below the average streaming rate, a practically infinite recording time (limited only by disk space and speed) possible. The peak-rate is possible temporarily and is compensated by the internal memory of the PowerTrace extension.
5 Depends on Whisker plugged to CombiProbe.
Maximize Bandwidth with AutoFocus Technology
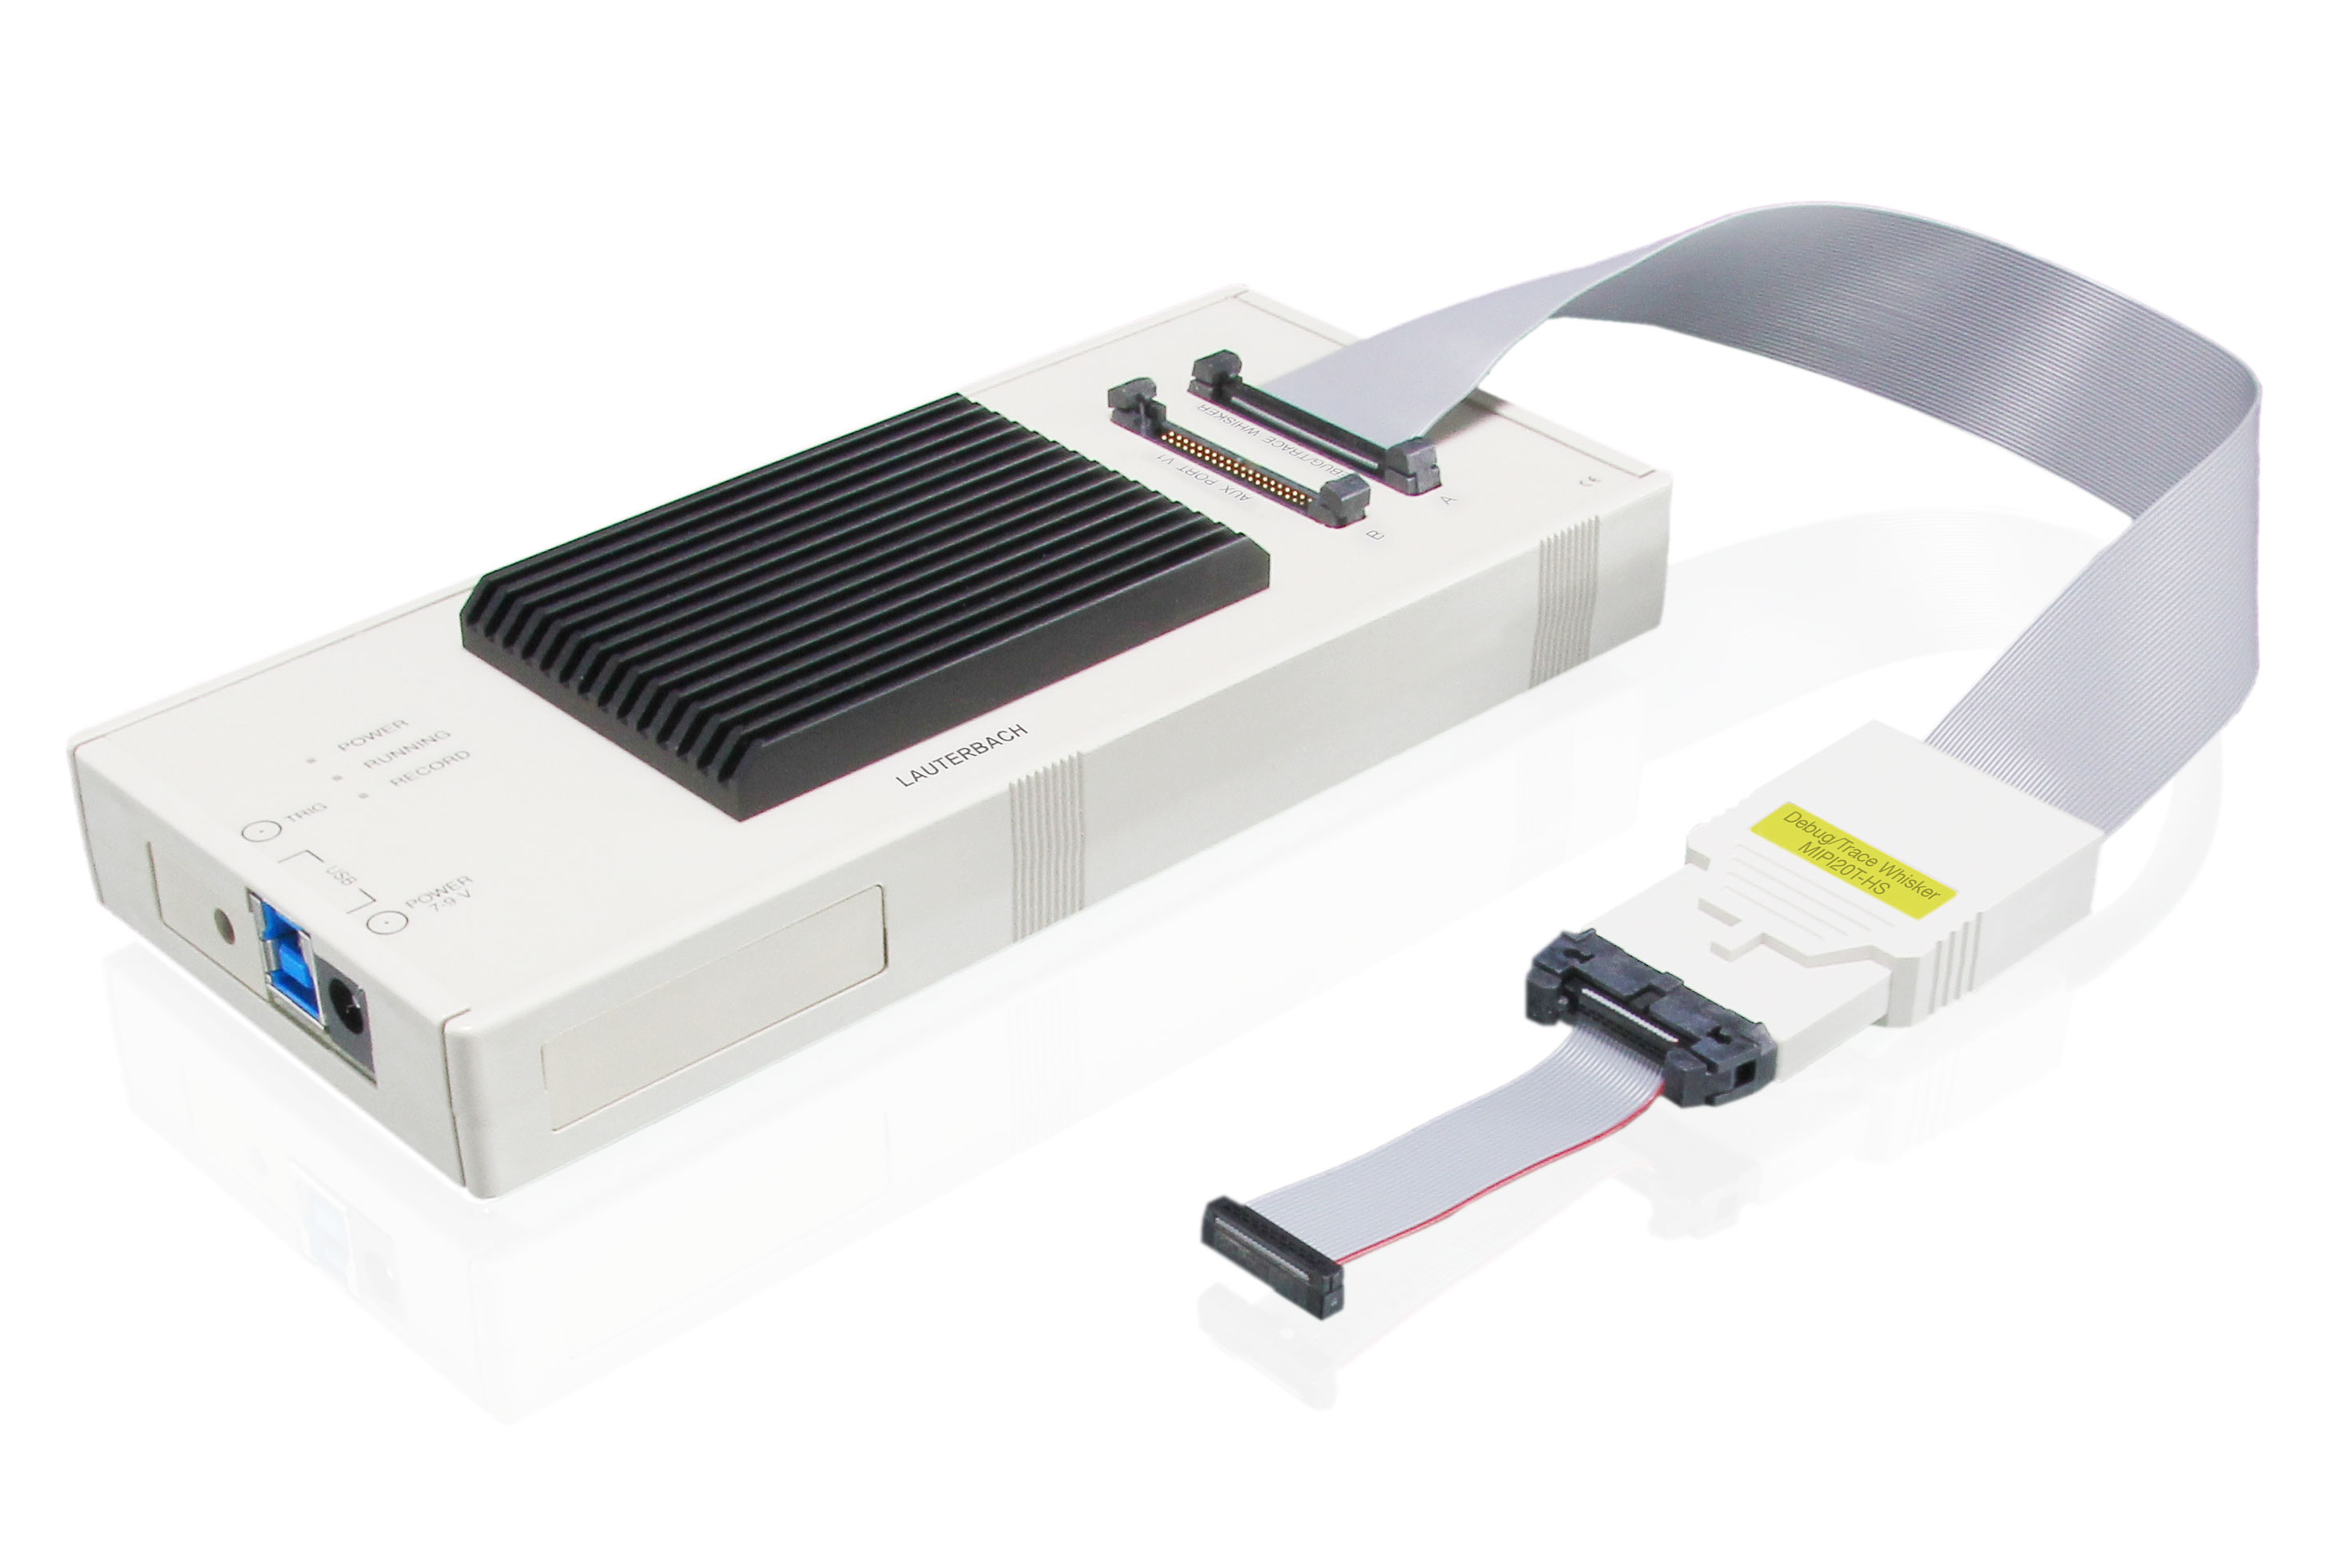
µTrace connects to your target’s debug/trace port via its included MIPI20T-HS whisker. This whisker supports our AutoFocus technology, which automatically adjusts the sampling point for each signal of your trace lines. This results in more reliable trace capture, with less concern about board routing, impedance, and length matching.
See Whisker MIPI20T-HS Know the AutoFocus technology

Configuration Examples for µTrace®

Application Profiling & OS-Aware Cortex-M Debugging
Beyond debugging, µTrace® supports the recording of the program flow and user-selected data address accesses over time. You can imagine it like recording a movie of what is happening inside the chip in real-time by utilizing Embedded Trace Macrocell (ETM), Data Watchpoint and Trace unit (DWT) and CoreSight ITM. Our PowerView software correlates both trace streams emitted by the Trace Port Interface Unit (TPIU). As a result, you can review precisely which instruction caused a particular data access. The correlation also enables you to profile your application with the awareness of the task switches by your target’s Operating System.
Configuration Products
- µTrace for Cortex-M (incl MIPI20T-HS Whisker)

Record Digital/Analog Signals plus Correlation with Program Flow
For the numerous Cortex-M chips implementing a CoreSight Trace Port Interface Unit (TPIU), µTrace® can correlate digital/analog signals with the program flow because it provides a common time-stamp for both recordings. You can achieve very long trace recordings by streaming both program flow trace and signal recording on-the-fly to your host computer. For decoding the recorded digital signals, our TRACE32® PowerView software comes with a number of built-in protocol analyzers for common interfaces such as CAN, USB and I2C. It can be easily extended to add your own custom protocol analysis capabilities.
- µTrace for Cortex-M (incl MIPI20T-HS Whisker)
- Mixed-Signal Probe

Debug and Trace of 32-bit RISC-V (RV32) Cores
µTrace® for RISC-V is a cost effective solution for debugging myriad 32-bit RISC-V cores and provides all of the well-known TRACE32® features. When you want to eventually debug additional instruction sets, you can easily switch over to any of our other debug products while using the same debug software. The latest RV32 cores often come with tracing capabilities such as N-Trace for profiling and code coverage. µTrace® supports all RISC-V traces stored in an onchip buffer or emitted via a 4-pin offchip-interface such as RISC-V PIB or CoreSight TPIU.
-
µTrace for RISC-V 32-Bit (PACK)
µTrace® Variants and Extensions
All-In-One Debug and Trace Solution for Arm Cortex-M. Supports 5-pin standard JTAG, cJTAG and Serial Wire Debug Port for Arm Cortex-M cores and SecurCore SC000/SC300 Supports Cortex-M onchip-trace and parallel offchip-trace with up to 4-bits (if supported by the core as well) including ETM flow traces, ITM instrumentation traces and DWT data traces. ITM/DWT can be captured from Serial Wire Output (SWO) as well. Includes 256-MByte of trace RAM. Bandwidth of 400 MBit/s per physical trace pin. Trace Streaming up to 140 MByte/s. Concurrent debugging of two or more Cortex-M cores requires a license for Multicore Debugging MicroTrace (LA-7960N). Can not be upgraded to include support for other core architectures. Extend your MicroTrace with a Mixed-Signal Probe (LA-2500), to record and correlated digital and analog signals.
All-In-One Debug and Trace Solution for 32-bit RISC-V cores (RV32). Supports 5-pin standard JTAG, cJTAG and Serial Wire Debug Port. Supports onchip-trace and 4-bit parallel offchip-trace of RV32 cores (if supported by the core as well). Includes 256-MByte of trace RAM. Bandwidth of 400 MBit/s per physical trace pin. Trace Streaming up to 140 MByte/s. Concurrent debugging of two or more RV32 cores requires a license for Multicore Debugging MicroTrace (LA-7960N). Can not be upgraded to include support for other core architectures. Extend your MicroTrace with a Mixed-Signal Probe (LA-2500), to record and correlated digital and analog signals.
Digital/Analog probe with 40-pin connector for LA-3204 MicroTrace for Cortex-M (PACK), LA-3080 CombiProbe 2 for MIPI20T-HS (PACK), LA-3081 CombiProbe 2 for AUTO26 (PACK), LA-3082 CombiProbe 2 for MIPS32+4-Bit IFLOW (PACK), LA-3083 CombiProbe 2 for MIPI34 (PACK), LA-2520 / LA-2521 PowerTrace III, LA-3121 / LA-3122 PowerTrace Serial 2. Characteristics of digital probe: 12 channels (12 data), 0..5 V Input, 200 MSamples per channel. Characteristics of analog probe: 6 Channels -12V..+12V 13 bit resolution, 2 current sense channels, Conversion rate 1 MSample/s. Includes a set of ten miniature clamp-type test probes with wires. More test probes can be ordered via LA-6470 Clip Set. Requires TRACE32 software DVD 2021/02 or newer.
Allows the concurrent debugging of 2 or more identical cores Please add the base serial number of your MicroTrace to your order


